
Case Study as part of a Web-based
Technical and Regulatory Guidance
Dunka Mine
Minnesota
1. Site Information
1.1 Contacts
Paul Eger
Minnesota Department of Natural Resources
Telephone: 651-259-5384
E-mail: [email protected]
1.2 Name, Location,
and Description
The Dunka Mine is a large, open-pit taconite mine located in northern Minnesota
at the eastern end of the Biwabik Iron Formation. The mine covers approximately
160 hectares and has a depth of around 100 m. It sits along the western
edge of a small watershed (920 hectares), which is drained by a small stream
(Unnamed Creek, Figure 1-1). The watershed is typical for this area of
Minnesota and is characterized by a series of upland ridges and low areas
containing wetlands. Sulfide-containing waste material from the mine was
stockpiled along the eastern edge of the mine and adjacent to these wetlands.
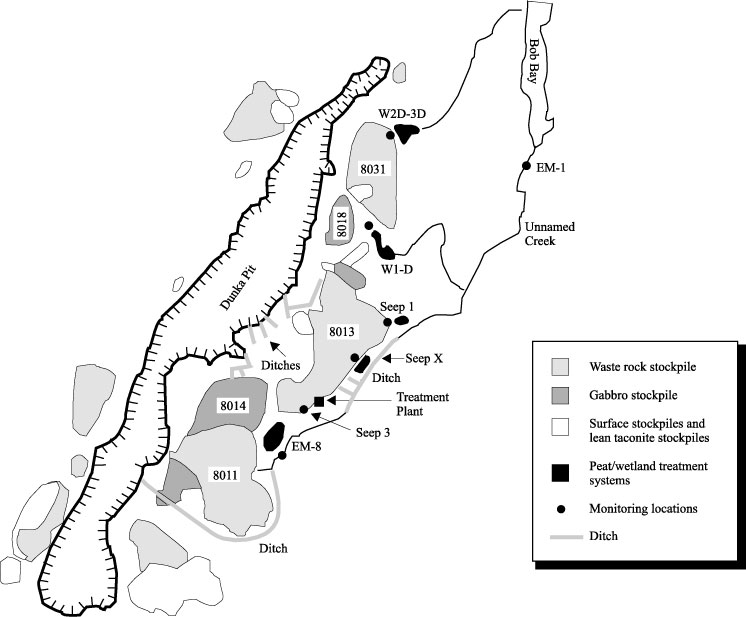
Figure 1-1. Dunka Mine waste location schematic.
The sulfide material came from an igneous intrusive rock formation known as the Duluth Complex. This formation is a gabbro which contained disseminated copper and nickel sulfides and overlies some of the iron ore at this site. During 30 years of operation, over 50 million metric tons of sulfide-containing waste was removed and stockpiled on 120 hectares of land adjacent to the mine. As water infiltrated this material, drainage with elevated copper, nickel, cobalt, and zinc was produced. Due to shallow water tables, precipitation that infiltrates the stockpiles appears as seepage in many places along the toes of the stockpiles. Although some of this seepage is diffuse, the majority of the flow occurs as discrete flow, which generally flows continuously from spring melt in April till freeze-up in late November. Average flows from the various seepages prior to closure have ranged from 3 L/min to 840 L/min, but flows exceeding 6000 L/min had been observed after periods of heavy precipitation. Annual median concentrations in the drainage from the stockpiles of Duluth Complex have ranged 1.5–50 mg/L for nickel, <0.1–1 mg/L for copper, <0.1–3 mg/L for cobalt, and <0.1–4 mg/L for zinc. Most of the drainage had pH greater than 6.5, but two sites produced acidic drainage.
2. Redial Action and Technologies
In 1986, LTV conducted a preliminary feasibility
study to determine the best method to mitigate the drainage problem at the
Dunka Mine, examining both active treatment systems (lime treatment, reverse
osmosis) and passive alternatives (limiting infiltration into stockpiles,
wetland treatment) (Barr Engineering 1986). An active treatment plant which
would treat all the stockpile drainage was projected to have a capital cost
of $8.5 million and an annual operating cost of $1.2 million. The passive
alternative was projected to cost $4 million to construct but only $40,000
in annual maintenance. Since mine drainage problems can persist for over
100 years, LTV decided to pursue passive alternatives.
However, acidic drainage developed in 1989 at a site (Seep 3) which had previously been neutral (Figure 1-1). As a result, the company was forced to construct a lined equalization pond and an active treatment plant to treat seeps emanating from some of the stockpiles on the eastern side of the mine. LTV’s goal was still to have a completely passive system, and when the decision to close the mine was made in 1991, LTV began to develop and implement a final closure plan. This plan included reducing infiltration into the stockpile and treating all residual drainage with wetland treatment systems. Since there was a limited area available for construction and wetland systems function best under low-flow conditions, it was important that the flow rates be reduced as much as practical. This was accomplished by reducing the upstream watershed which may contribute to the drainages and by capping the stockpiles to limit infiltration of precipitation.
Watershed Reduction, Diversion
LTV conducted an extensive investigation of the surface and groundwater
in the area and identified several areas where surface water was believed
to flow through Duluth Complex stockpiles. Drainage ditches were constructed
to route water away from the piles (Figure 1-1). Although most of these were
relatively shallow ditches (~2 m), the ditch at the southern end of the mine,
around the 8011 stockpile, was much larger. To isolate a relatively large
upstream watershed (83 hectares), a 670 m long ditch, up to 18 m deep, was
excavated through bedrock into the mine. The original plan was to drill and
blast to fracture the bedrock and create a drain. The drain did not have
sufficient permeability to drain the area, and as a result, the bedrock had
to be excavated. This ditch cost over $600,000 and accounted for the majority
of the total ditching budget.
Based on the hydrological study, LTV also concluded that by channelizing flow in Unnamed Creek it could lower the water level in the surrounding wetlands and, as a result, reduce the amount of water in contact with the stockpile in these wetlands. The channelization project included straightening and deepening portions of the stream and required cutting through bedrock at several locations (Figure 1-1).
Limiting Infiltration into Stockpiles, Capping
Once
the amount of surface and groundwater entering the piles had been minimized,
the next step was to limit the volume of precipitation entering the stockpiles.
Minnesota’s mineland reclamation rules require that the tops and benches
of rock stockpiles that do not produce water quality problems be covered
with 2 ft of soil and vegetated. When water quality problems exist, additional
steps to limit infiltration must be taken. Traditionally, infiltration is
decreased by covering the waste with several feet of clay. For this mine,
the nearest clay source is over 40 miles away, and the high transportation
cost to the site made this approach too expensive. As a result, a pilot test
was conducted to investigate the effectiveness of various cover systems (Eger,
Antonson, and Udoh 1990). These results, in addition to computer model runs
using the EPA HELP model (Schroeder et al. 1984), were used to design an
approach to selecting covers for each of the stockpiles based on the chemical
composition of the pile and the observed water quality in the drainage.
Stockpiles that contained Duluth Complex material with less than 0.2% CuO and less than 0.05% NiO and that produced neutral drainage were covered with 2 ft of native soil, with at least 10% silt (-200 mesh), screened to minus 15 cm. Stockpiles containing more mineralized material and/or with acid drainage were covered with a barrier layer of compacted soil or a 30-mil low-density polyethylene liner (Table 2-1). Since these stockpiles were constructed prior to the realization that a water quality problem would develop, the piles were constructed to place the maximum amount of material in the minimum area. Stockpiles were generally built in 10–15 m lifts with 45° side slopes. Only the flat top portions of the stockpiles could be economically covered.
Table 2-1. Stockpile capping summary, LTV Dunka Mine
Stockpile |
Area Capped (hectares) |
Stockpile Classification |
Cap |
Costs |
|
Total |
$/hectare |
||||
8011 |
14 |
Waste rock |
Screened soil, no barrier | 445,000 |
32,000 |
8031 |
22 |
Waste rock |
Screened soil, no barrier | 835,700 |
38,000 |
8013 |
21 |
Waste rock |
Compacted soil barrier | 1,180,000 |
56,000 |
8014 |
18 |
Gabbro |
Screened soil. A flexible membrane liner was placed over a mineralized portion of the pile. | 963,000 |
54,000 |
8018 |
3.7 |
Gabbro |
Flexible membrane liner | 455,000 |
123,000 |
Constructed Treatment Wetlands
In 1988, four pilot wetland cells were built to determine the feasibility
of using wetland treatment to remove metals from stockpile drainage at the
Dunka Mine. Nickel removal was on the order of 90%, and the cells were capable
of producing water that met water quality standards (Eger et al. 1994, 1993).
Based on these results, LTV designed and constructed two wetland systems
in 1992 (Eger and Melchert 1992, Frostman 1992). These systems were 4200
m2 (W2D/3D) and 7000 m2 (W1D) and were designed to treat water with 1–5 mg/L
nickel and flows on the order of 75 L/min.
These systems were constructed with a series of pools and soil berms to reduce the hydraulic gradient and contained a substrate which was a mixture of peat and peat screenings (a waste product from the production of horticultural peat) between the berms. In 1995, one of the original wetlands (W1D) was increased by 10,000 m2, and two new systems (Seep 1, Seep X) were built (Eger, Wagner, and Melchert 1996). These new systems also contained a series of soil berms, but every other berm in the cell had a limestone cobble base to permit underflow through the berm.
In 1997, another wetland (EM8) was designed and constructed to maintain water level at a uniform depth of 10–15 cm, better distribute flow, and maximize treatment area. Input flow is controlled by three adjustable stainless steel weirs, and adjustable stop log style weirs were built on all of the berms in the system. A summary of the size, water quality, and cost for each of the wetlands is presented in Table 2-2.
Table 2-2. Wetland treatment summary, LTV Dunka Mine
Site |
Times |
Size m2 |
Flow |
Design Factors-Input |
Performance Factors-Output |
Cost ($) |
||||||||
Metal Concentrations (mg/L) |
Metal Concentrations (mg/L) |
|||||||||||||
L/min |
pH |
Ni |
Cu |
Co |
Zn |
pH |
Ni |
Cu |
Co |
Zn |
||||
| W2D/3D | 1992-97 |
4200 |
75 |
7.0 | 1.9 | 0.05 | 0.02 | 0.05 | 7.0 | .08 | .004 |
.002 |
.008 |
75,000 |
| WID Expanded |
1992-97
1995-97 |
7000
17,000 |
150
130 |
7.07
7.14 |
3.98
1.20 |
0.68
.059 |
.036
.023 |
0.52
0.17 |
7.18
7.38 |
.70
.18 |
.010
.005 |
.008
.001 |
.013
.011 |
125,000
244,000 |
| Seep 1 | 1995-97 |
2500 |
20 |
6.94 | 5.39 | .15 | .13 | .65 | 7.23 | 1.85 | .05 |
.04 |
.29 |
192,000 |
| Seep X | 1995-97 |
10,000 |
100 |
7.03 | .150 | .33 | .08 | .48 | 7.13 | .61 | .08 |
.02 |
.21 |
282,000 |
| EM8 | 1998 (Jan-Sept.) |
16,000 |
310 |
7.20 | 1.6 | .029 | .015 | .059 | 7.01 | .902 | .011 |
.006 |
.033 |
290,000 |
| Water Quality Standard |
6.5- 8.5 |
.213 | .023 |
.05 |
.343 |
|||||||||
Total Cost |
$1,200,000 |
|||||||||||||
| Note: The flow and metal concentration values persented are the average values of the periods of record. | ||||||||||||||
3. Performance
Flow Reductions Related to Ditching and Infiltration Control
Since
reducing the upstream watershed and limiting infiltration into the stockpile
will decrease the total flow from the stockpile, the effectiveness of these
steps must be considered together. Diverting upstream flow reduced the watershed
contributing to flow at Seep X and EM8 by 13% and 54%, respectively. Most
of the other ditching did not affect the watersheds which contributed to
the major discrete seepages but reduced the overall watershed through the
stockpiles. The largest watershed affected was upstream of the 8011 stockpile,
in which 83 hectares were removed from the watershed.
Stockpile capping began in 1991 when 21 hectares of stockpile 8013 was covered with a cap consisting of 27 cm of compacted soil and 60 cm of soil cover (Gale 1992). The top of the stockpile was extensively contoured with a complex of ridges and ditches and four 76 cm culverts were installed to carry water off the pile. Observations and periodic measurements indicate that a substantial quantity of water is routed off the piles, particularly during spring melt (G. Halberg, LTV Steel Mining Co., Hoyt Lakes, Minn., personal communication, 1997). Flow monitoring instrumentation was installed in 1998 so that quantitative data can be collected. Since 1989, LTV has capped about 76 hectares of stockpiles containing Duluth Complex material, with capping material ranging from uncompacted soil to 30 mil polyethylene membranes.
Flow measurements for most of the seeps were made from water level measurements. All seeps were instrumented with a Stevens level recorder and a 60° v-notch weir. Continuous flow measurements are generally available from May 1 to October 31. Freezing temperatures before and after these dates often makes collection of continuous data difficult. As a result, flow during spring melt is generally not recorded. Although this flow can be substantial, 74% of the annual precipitation in northeast Minnesota occurs during the months of May through October. In the past, estimates of spring and fall flow have been made (Eger, Lapakko, and Weir 1981), but for purposes of comparing the effectiveness of the stockpile capping program, only the data representing actual flow measurements have been used.
The sites with the best long-term record and the largest changes to the watershed contributing to the drainage were EM8 and W1D. In the early 1990s the watershed that contributes to EM8 was reduced by 54% by an extensive and expensive ditching program, and in 1996 and 1997 the flat portions of the stockpile were covered with native soil and vegetated. Since 2006, average volume for May through October was around 100 million L. Prior to any activity which might have dramatically altered the flow at EM8 (1977–1979), the flow for this same period was 240 million L, more than twice the post-reclamation flow.
At W1D, around 60% of the total area of the stockpile was covered with 30 mil polyethylene. Since the stockpile contributes 40% of the total area to the monitoring weir, an overall flow reduction of around 25% was expected. Data from the first two years after capping indicate that flow from May through October decreased 36%, from an average of 36 million to 23 million L.
Reductions in infiltration for the covered portions were predicted to range from 40% for native soil to over 90% for flexible membrane liners. Since the side slopes were not covered, the total reduction in flow would be a function of the ratio of the area of the top to the total area of the stockpile.
Wetland Treatment
All the wetlands at the Dunka Mine have been effective
at removing metals, but some are not always effective at achieving compliance
with permit limits. Annual average metal removal has ranged around 60%–90%
for nickel, 70%–90% for copper, 70%–90% for cobalt, and 50%–75% for zinc
(Table 2-2). The ability to achieve compliance is largely a function of the
wetland’s size and the hydraulic and metal loading rate. The Dunka wetlands
range in size 2500–17,000 m2, and the average nickel loading rate ranges
15–70 mg/m2/day. Pilot-scale tests indicated that adequate nickel removal
could be achieved with a residence time as low as two days, and that nickel
removal rates were on the order of 40–80 mg/m2/day (Eger et al. 1994). With
the exception of the system constructed in the fall of 1997 (EM8), the wetland
systems were constructed with a series of berms and pools that ranged in
depth 0.3–0.6 m. This design increases the overall residence time in the
systems but decreases the area where the drainage is in direct contact with
the substrate. Flow channels have developed at the low spots in the berms,
further reducing contact with the substrate. The newly constructed system
at EM8 was built to control the distribution of flow and to maximize contact
with the substrate. This system is expected to have much less flow channelization
and provide better metal removal than the older wetlands.
Although the wetland systems are generally effective at removing metals, efficiency tends to decrease as temperatures decrease in the fall. In general, stockpile flow ceases during the winter as precipitation accumulates as snow and seep flow freezes. Most of the stockpile drainage ceases in the winter, but some winter flow has been observed at site Seep X and EM8. Limited data from the outflow of the Seep X system suggest that treatment decreases substantially during winter, with outflow concentrations approaching inlet concentrations in December (Figure 3-1).
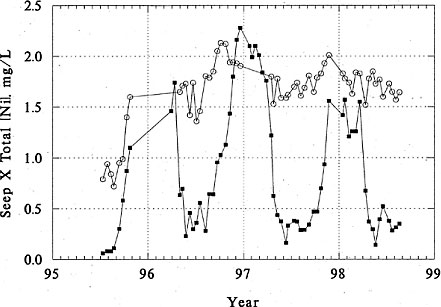
Figure 3-1. Nickel concentrations in the outflow from Seep X. Dark squares are output concentrations, and open circles are input concentrations. Concentrations increase in the fall and approach inlet concentrations in December.
Nickel removal in the test cells and the WID system also decrease in the fall (Eger et al. 1994; Eger, Wagner, and Melchert 1996). Winter operation data for other wetland systems are limited, but year-round copper removal has been reported in British Columbia (Sobolewski, Gormely, and Kistritz 1995), and metal removal was also observed throughout the winter in the Big 5 Tunnel pilot cells in Colorado (Wildeman et al. 1991). Recent work in Montana also found that metal removal occurred during winter operation (J. Pantano, Arco Mining, Anaconda, Mont., personal communication, 1997). Additional data is needed on the LTV systems to determine whether these systems can meet water quality standards throughout the year.
4. Costs
Mine closure is an expensive undertaking. LTV has spent over $6.5 million
to close the Dunka Mine. Capping the stockpiles containing Duluth Complex
material was the most expensive cost at around $3.9 million. Costs ranged
from $32,000/hectare for a soil cover to $123,000/hectare for flexible
membrane liners. These costs generally included some reshaping of the stockpiles.
Covering the stockpiles with 2 ft of native soil, as required by mineland
reclamation laws, generally costs about $20,000–25,000/hectare.
A total of $1.2 million was spent to construct the wetland systems. The design of these systems has changed over time; costs have ranged from $18/m2 for the systems built in 1992 and 1997, to $24-28/m2 for the systems with underdrains built in 1995.
Active treatment for the southern portion of the mine (which began in 1992), cost around $1.3 million to construct and has an annual operating cost of $200,000. Maintenance costs for the passive systems generally decrease as vegetation becomes established on the stockpiles and in the wetlands, and by the fourth season, the only maintenance required was the annual inspections in the spring and fall. LTV has projected an annual maintenance cost of less than $2,000, or less than 1% of the cost of the actual plant. With an annual savings of $198,000, LTV will recover the cost of the wetland treatment systems in about six to seven years.5. Regulatory Challenges
Although all the wetland treatment systems removed metals, removal varied
substantially between systems and among metals and only two systems were
able to meet the original water quality–based standard. As a result, regulatory
flexibility was needed to allow passive treatment to continue.
Standards were raised to include the hardness of the discharges, and then variances were granted for two of the sites. The basic requirement was that the discharge could not be acutely toxic. In order to ensure that the variance was not causing impacts to the receiving stream, the company was required to increase its biological monitoring of the receiving stream.
Water Quality Standards
In Minnesota, all effluents must be nontoxic. Therefore at a minimum,
metals concentrations must be below the Final Acute Values (FAV, Minnesota
Rules, Chap. 7050). Since metal toxicity decreases as hardness increases,
permissible metal concentrations generally increase with hardness up to
a maximum allowable hardness of 400 mg/L as CaCO3. For the metals at Dunka,
the final acute values range from 126 µg/L for copper to 9136 µg/L for
nickel (Table 5-1). Due to limited toxicity data on cobalt, no provision
for hardness is included in the rules. LTV conducted a site-specific bioassay
study, which demonstrated that cobalt toxicity decreased as hardness increased.
Originally, permit standards for the mine were based on chronic toxicity values, which were up to an order of magnitude lower than acute values (Table 5-1). When the company went bankrupt several years after the mine had closed, it sought a variance for several of the discharges. The new permit based standards on FAV include biological monitoring in the receiving stream to insure that the higher concentrations were not producing any adverse impacts on the aquatic system. Since the seeps at Dunka contain a mixture of metals, the current permit assumed that the toxicity of the effluent would be equal to the sum of the toxicities from the individual metals. Therefore, to ensure that the effluent was nontoxic, the permit requires the following:
∑ Concentration of metal ≤ c1
Final
acute value
Table 5-1. Minnesota water quality standards
Concentration in µg/L; hardness in mg/L CaCO3.
Trace metal |
Standard |
Hardness, 50 |
Hardness, 100 |
Hardness, 200 |
Hardness, 400 |
| Copper | CS | 6.4 |
9.8 |
15 |
23 |
| MS | 9.2 |
18 |
34 |
63 |
|
| FAV | 18 |
35 |
68 |
126 |
|
| Nickel | CS | 88 |
158 |
283 |
508 |
| MS | 789 |
1418 |
2549 |
4568 |
|
| FAV | 1578 |
2836 |
5098 |
9136 |
|
| Zinc | CS | 59 |
106 |
191 |
343 |
| MS | 65 |
117 |
211 |
3784 |
|
| FAV | 130 |
234 |
421 |
7567 |
|
| Cobalt* | CS | 2.8 |
2.8 |
2.8 |
2.8 |
| MS | 436 |
436 |
436 |
436 |
|
| FAV | 872 |
872 |
872 |
872 |
| Standards: CS = chronic standard, MS = maximum standard; FAV =
final acute value. CS is defined as “the highest water concentration of a toxicant to which organisms can be exposed indefinitely without causing chronic toxicity.” This is considered the ambient in stream water quality standard, which must be met on an average basis. MS is defined as “the highest concentration of a toxicant in water to which aquatic organisms can be exposed for a brief time with zero to slight mortality. The MS equals the FAV divided by 2.” This is considered the ambient in stream concentration that cannot be exceeded on any given day. FAV is defined as “an estimate of the concentration of a pollutant corresponding to the cumulative probability of 0.05 in the distribution of all the acute toxicity values for the genera or species from the acceptable acute toxicity tests conducted on a pollutant.” By rule, any wastewater discharge must not exceed these standards at end-of-pipe at any time. *LTV conducted site-specific testing and demonstrated that cobalt toxicity was a function of hardness. The cobalt chronic value for the Dunka Mine was increased to 50 μg/L. |
Additional variances were granted for the Seep 1 and Seep X systems for spring flow and the company instituted a contingency plan to avoid water quality violations. If the concentrations in the outfall exceed the variance levels, water is collected and pumped to the beginning of the W1D system. Although this procedure has been effective, it is costly and cumbersome.
6. Stakeholder Challenges
None reported.
7. Other Challenges and Lessons
Learned
Part of the explanation for the difference in performance of the wetland
treatment systems at the Dunka Mine appears to be the size of the treatment
systems. Before the systems were built, pilot tests were conducted to determine
the ability of wetlands to treat the stockpile drainage and to develop
criteria to design full scale systems (Eger and Lapakko 1989; Eger et al.
1991, 1993, 1994; Eger, Wagner, and Melchert. 1996). Based on these tests,
the average areal removal rate for nickel was about 40 mg nickel/m2/day.
Using this value and the estimated nickel loading to the wetland, the area
required to treat each seep was calculated. Area ranged from about 0.4 hectare
(4100 m2) for Seep 1 to about 3.2 hectares (32,200 m2)
for EM8 (Table 7-1).
Table 7-1. Wetland sizing
Seep |
Input |
Area (m2) |
|||||||
Average flow (L/min) |
Average concentration (mg/L) |
Daily load (mg/d × 103) |
Calculated* |
As built |
Expanded |
||||
|
|||||||||
75 |
2 |
216 |
5,000 |
4200a |
|||||
45 estb |
2 |
130 |
3,000 |
||||||
|
|||||||||
150 |
4 |
864 |
23,000 |
7000 |
17,000c |
||||
40 |
0.8 |
1,200 |
|||||||
| Seep 1 | 20 |
5.4 |
156 |
4100 |
2500 |
||||
| Seep X | 100 |
1.5 |
216 |
5000 |
10,000 |
||||
| EM8d | 400 |
2.1 |
1210 |
32,200 |
16,000 |
||||
| * |
Area required. Based on an areal removal
rate for nickel of 40 mg/m2 day, which is average from test cells. |
| a | This is the size of the constructed portion. There is about an additional 2,000 m2 of natural wetland before the discharge monitoring point (SD-006). |
| b | The 8031 was covered with 2 ft of local soil and revegetated. After successful reclamation, flow is reduced by about 40% (based on field data from test stockpiles and HELP model). |
| c | Wetland was expanded in 1995. |
| d | Flow data from 1997. Data 2001–2003: average flow 1140, which is higher than prereclamation flow data being checked. |
| For Seep 1, Seep X, the systems were built
after the stockpile was capped in the fall of 1991, so there were no
changes due to reclamation activity. Note: Average flow is based on May–October records when continuous flow records are available. |
|
In general, adequate treatment was achieved when the size of the wetland
exceeded the calculated area. Originally the W1D system was not effective
in meeting the original permit requirements, but performance improved after
the system was expanded (Eger, Wagner, Melchert 1996). After the stockpile
was reclaimed, the original part of the system met the criteria and currently
meets the original water quality standard.
One of the most common reasons for the failure of wetland treatment systems is that the systems were too small (ITRC 2003). Wetlands can be effective, but in general, sufficient land must be available. Insufficient area was available at both Seep 1 and EM8, and the current systems are only about half of the calculated size.
Although the size of the Seep X wetland appears to be adequate for nickel removal, the effective treatment size is substantially smaller than the total size of the system. This system contains a series of soil berms that reduces the effective treatment area by about 20%. Field observations revealed that the flow is not equally divided between the two cells and that the northern portion of the wetland receives about three times as much water as the southern section.
Water is routed through the overflow berms by a series of pipes, which further tends to concentrate flow and lessen contact with the substrate. In addition, the limestone drains were not effective in transmitting flow through underflow berms. The hydraulic gradient in the system is only about 1%, and the permeability of the peat mixture is at best on the order of 10–3 cm/sec. Under these conditions, the drains could only transmit a few percent of the flow. Visual observation confirmed that a large volume of water was moving over the top of the underflow berms. Seep X also flows during most of the winter, and channelization increases dramatically as areas with little water movement freeze. Metal removal decreases too less than 10% during the winter, and the FAV of outfall is essentially the same as the input. Channelization has also been observed in the Seep 1 system, and despite the inclusion of level maintenance structures in EM8, flow has not been evenly distributed partially due to a lack of maintenance and adjustment of the level control structures.
In 2004 substantial renovation was performed on the Seep 1 and Seep X systems. The goal was to provide better flow distribution and increase the contact of the drainage with the peat substrate. Berms, which had subsided, were raised by adding limestone to the surface, and additional peat was added to some of the open water areas to increase the amount of reactive surface area. Maintenance work on the EM8 system was scheduled to occur during the summer of 2005.
In contrast, maintenance requirements for the W2D/3D and the W1D expanded system have been minimal. The systems were built with sufficient area to treat the original flow, and water quality and reclamation activities have further reduced the input load so that both systems are estimated to be have lifetimes well in excess of 100 years. Based on a model that calculates the addition of new removal sites, it appears that for the W1D system, there are enough new removal sites generated each year to remove the annual nickel load from the stockpile (Eger and Wagner 2002). As a result, the wetland can theoretically remove nickel in perpetuity.8. References
Barr Engineering. 1986. Feasibility Assessment of Mitigation Measures
for Gabbro and Waste Rock Stockpiles—Dunka Pit Area. Prepared for
Erie Mining Company, Hoyt Lakes, Minn.
Eger, P., D. Antonson, and F. Udoh. 1990. “The Use of Low-Permeability Covers to Reduce Infiltration into Missing Stockpiles,” presented at Western Regional Symposium on Mining and Mineral Processing Wastes, May 30–June 1, Berkeley, Calif.
Eger, P., and K. A Lapakko. 1989. “The Use of Wetlands to Remove Nickel and Copper from Mine Drainage,” in Constructed Wetlands for Wastewater Treatment, D. Hammer, ed. Chelsea, Mich.: Lewis.
Eger, P., K. A. Lapakko, and A. Weir. 1981. The Environmental Leaching of Stockpiles Containing Copper-Nickel Sulfide Minerals: A Study of Chemical Release, Chemical Transport, and Mitigation Conducted at Erie Mining Company’s Dunka Mine, Babbitt, MN, 1976–1980. St. Paul: Minnesota Department of Natural Resources, Division of Minerals.
Eger, P., and G. Melchert. 1992. “The Design of a Wetland Treatment System to Remove Trace Metals from Drainage,” pp. 98–107 in Achieving Land Use Potential through Reclamation, Proceedings, 9th National American Society for Surface Mining and Reclamation Conference, June 14–18, Duluth, Minn.
Eger, P., G. Melchert, D. Antonson, and J. Wagner. 1991. The Use of Wetland Treatment to Remove Trace Metals from Mine Drainage at LTV’s Dunka Mine. St. Paul: Minnesota Department of Natural Resources, Division of Minerals.
Eger, P., G. Melchert, D. Antonson, and J. Wagner. 1993. “The Use of Wetland Treatment to Remove Trace Metals from Mine Drainage,” in Constructed Wetlands for Water Quality Improvement, G. Moshiri, ed. Boca Raton, Fla.: Lewis.
Eger, P., and J. Wagner. 2002. “The Use of Wetlands to Remove Nickel from Mine Drainage: Is Perpetual Treatment Really Possible?” in Proceedings, American Society of Mining and Reclamation Meeting, June 9–13, Lexington, Ky.
Eger, P., J. Wagner, Z. Kassa, and G. Melchert. 1994. “Metal Removal in Wetland Treatment Systems,” Proceedings, International Land Reclamation and Mine Drainage Conference/3rd International Conference on the Abatement of Acidic Drainage, April 25–29, Pittsburgh.
Eger, P., J. Wagner, and G. Melchert. 1996. “The Use of Overland Flow Wetland Treatment Systems to Remove Nickel from Neutral Mine Drainage,” pp. 580–89 in Success and Failures: Applying Research Results to Insure Reclamation Success, Proceedings, 13th National American Society for Surface Mining and Reclamation Conference, May 18–23, Knoxville, Tenn.
Frostman, T. 1992. “Constructed Peat/Wetland Treatment System for Heavy Metal Removal,” pp. 255–59 in Achieving Land Use Potential through Reclamation, Proceedings, 9th National American Society for Surface Mining and Reclamation Conference, June 14–18, Duluth, Minn.
Gale, L. 1992. “Reclamation of Minerock Stockpiles,” p. 232 in Achieving Land Use Potential through Reclamation, Proceedings, 9th National American Society for Surface Mining and Reclamation Conference, June 14–18, Duluth, Minn.
ITRC (Interstate Technology & Regulatory Council ) 2003. Technical and Regulatory Guidance for Constructed Treatment Wetlands. WTLND-1. Washington, D.C.: Interstate Technology & Regulatory Council, Mining Waste Team. www.itrcweb.org.
Schroeder, P., J. Morgan, T. Walskiand, and A. Gibson. 1984. The Hydrologic Evaluation of Landfill Performance (HELP) Model, vol. 1, Users Guide for Version 1. EPA/530/2-87/050. U.S. Environmental Protection Agency Technical Resource Document.
Sobolewski, A., L. Gormely, and R. U. Kistritz. 1995. “Copper Removal from Mine Drainage by an Experimental Wetland at Bell Copper Mine,” pp. 683–92 in Proceedings, Sudbury ’95, Mining and the Environment, B. C Smithers, ed., May 28–June 1, Sudbury, Ontario.
Wildeman, T., L. Dugan, J. Bolis, and J. Gusek. 1991. “Constructed Wetlands that Emphasize Sulfate Reduction: A Staged Design Process and Operation in Cold Climates,” paper #32 in Proceedings, 24th Annual Canadian Mineral Processors Meeting, Ottawa, Ontario.