4. Data Evaluation
Data evaluation may include the following tasks:
- comparing analytical data to DQOs established in the data collection program (see Section 3.3)
- identifying significant data gapsMissing data or information needed to answer questions or allow a more refined analysis to be completed. (if any)
- performing statistical evaluations
- conducting preliminary exposureContact of a receptor with a chemical. Exposure is quantified as the amount of the chemical available at the exchange boundaries of the organism (for example, skin, lungs, gut) and available for absorption (USEPA 1989a). and risk characterizationThe risk characterization integrates information from the preceding components of the risk assessment and synthesizes an overall conclusion about risk that is complete, informative and useful for decision makers (USEPA 2000c). calculations
- developing visual representations of data, data reduction
- grouping data by exposure areaA geographic area over which a receptor is reasonably assumed to move at random and equally likely to come into contact with an environmental medium (for example, soil) both spatially and temporally. An exposure area is further defined on the basis of observed or assumed patterns of receptor behavior, historic activity, and the nature and extent of chemicals in environmental media (USEPA1989a). An exposure area may also be called an exposure unit.
- comparing chemical concentrations to risk-based screening values
This chapter provides guidance on key issues associated with evaluating data to develop a risk assessmentAn organized process used to describe and estimate the likelihood of adverse health outcomes from environmental exposures to chemicals. The four steps are hazard identification, dose-response assessment, exposure assessment, and risk characterization (Commission 1997a). that is representative of potential risks and acceptable to the stakeholdersA stakeholder is anyone who has a “stake” in the development, outcome or decisions made as a result of a risk assessment. A stakeholder can be a person, a group, or an organization that is either affected, potentially affected, or has any interest in the project or in the project’s outcome, either directly or indirectly (Commission1997a; Commission 1997b; NRC 1996; NRC 2009).. The key issues are organized around five general topic areas:
Data Gaps
Data Usability
- Presenting Measurement Units and Significant Figures
- Determining Cross-Contamination
- Assessing Data Representativeness
Data Reduction Concerns
- Using Duplicate Samples
- Pooling Data
- Handling Flagged Data Concentrations
- Handling Nondetect Concentrations
- Considering Outliers
- Addressing Tentatively Identified Compounds (TICs)
Data Visualization and Analysis
Data Screening and Chemical Selection Processes
- Identifying Appropriate Screening Values
- Identifying Chemicals for Evaluation in the Risk Assessment
- Addressing Chemicals that are Missing Screening Values
- Handling Nondetect Chemicals in Screening
- Addressing Data Bias in Screening Process
- Handling Background Concentrations
In many cases, the only data available for risk assessment are data collected as part of site characterization efforts, without considering risk assessment needs. A thoughtful data planning process (systematic planningA planning process that is based on the scientific method. It is a common-sense approach designed to ensure that the level of detail in planning is commensurate with the importance and intended use of the data, as well as the available resources. Systematic planning is important to the successful execution of all activities at hazardous waste sites, but it is particularly important to dynamic field activities because those activities rely on rapid decision-making. The data quality objective (DQO) process is one formalized process of systematic planning. All dynamic field activities must be designed through the use of systematic planning, whether using DQO steps or some other system. See also Data Quality Objective (USEPA 2015h)., see Section 3.3) is needed to develop a data set that can support both site characterization and risk assessment.
As indicated in Groundwater Statistics and Monitoring Compliance (ITRC 2013), USEPA’s DQO process is general enough to potentially incorporate different lines and types of data-based evidence. Statistics is one useful tool in this framework, as highlighted by USEPA’s Data Quality Assessment (DQA) (USEPA 2006b). Additionally, USEPA (2013g) notes the following:
[DQA] is used to assess the type, quantity, and quality of data in order to verify that the planning objectives, Quality Assurance Project Plan components, and sample collection procedures were satisfied and that the data are valid and suitable for [the] intended purpose … This assessment is a scientific and statistical evaluation of data to determine [whether] it is of the type, quantity, and quality needed. [DQA] may be performed either during a project to check the process of data collection or at the end of a project to check if objectives were met.
Guidance for how to conduct data validation and verification is provided on USEPA’s “Quality Management Tools – Data Verification and Validation” website (USEPA 2015c).
DQA is a procedure for determining whether or not a data set is suitable for its intended purpose. The DQA Process includes the following steps, as depicted in Figure 11 of USEPA's guidance (USEPA 2006c; USEPA 2006b):
- Review DQOs and sampling design.
- Revisit DQOs if necessary.
- Conduct preliminary data review.
- Select the statistical test.
- Verify the assumptions.
- Draw conclusions from the data.
Based on these steps, application of statistics should incorporate an iterative approach, including:
- Conduct up-front exploratory data analysis (Section 3.3.3, ITRC 2013) to better understand the data set, its usability, and its representativeness.
- Clearly formulate the study questions and the statistical inferences that must be made.
- Select the appropriate target population (Section 3.2.1, ITRC 2013) from which data will be drawn.
- Perform data quality assurance and quality control (QA/QC) checks—do the data meet appropriate QA/QC requirements?
- Apply appropriate statistical methods, check the assumptions of those methods, and assess whether reasonable answers have been obtained.
Even with systematic planning, uncertaintyThe lack of perfect knowledge of values or parameters used in a risk assessment. Uncertainty may be reduced by collection of additional data. is inherent in all scientific measurement. The level of uncertainty in a data set, however, must be low enough to answer the study questions with sufficient statistical confidence. In some cases, uncertainties can be addressed by collecting additional data or using more sensitive analytical methods. In other cases, uncertainty reflects a basic lack of knowledge about how the natural system functions. Identifying and managing uncertainty (ITRC 2011c) supports informed decisions in all stages of the project life cycle.
4.1 Data Gaps
A data gap exists when data or other site information is insufficient for adequately evaluating each potential exposure pathwayThe course a chemical takes from a source to a receptor. An exposure pathway describes a unique mechanism by which an individual or population is exposed to chemicals at or originating from a site. Each exposure pathway includes a source or release from a source, an exposure point, and an exposure route. If the exposure point differs from the source, a transport/exposure medium (for example, air) or media (in cases of intermedia transfer) also is included (USEPA 1989a). identified in the CSM. Data gaps introduce some level of uncertainty; however, the project team can determine whether the level of uncertainty associated with the data gap is acceptable or if additional data must be collected. Data gaps in field data are generally filled by collecting additional field data (for example, soil, groundwater, or air samples). Data gaps in other information are generally filled through online or library research and through additional data requests to agencies or organizations that collect, develop, store, or otherwise manage the needed information.
4.1.1 Issue – Identifying and Filling Data Gaps
Data gaps can be defined as questions that cannot be answered based on existing field investigation data or other available information (for example, maps, site development plans, and demographic information). A data gap in the context of risk assessment is missing information that, if available, would allow a more refined analysis to be completed.
4.1.1.1 Option – Collect Additional Data
Data collection and evaluation is an iterative process; therefore sampling plans should be flexible, while also systematic, repetitive, and recursive. Many times the first samples collected may not provide data of sufficient quality and representativeness to satisfy the requirements of the data collection program. A well-designed sampling plan builds on this first event to improve subsequent sampling. An example of this iterative process is the USEPA’s Triad approach, discussed in Section 3.2 of ITRC’s guidance (ITRC 2008) and presented in detail in Triad Implementation Guide (ITRC 2007b). Flexible sampling plans with built-in iterative sampling and analysis strategies encourage team collaboration and usually yield better results. As data are collected and evaluated, the plan becomes progressively modified as necessary. During the evaluation, information may be deemed significant and therefore emphasized, or may be found insufficient, creating more questions requiring additional sampling, or may be considered anomalous and possibly discarded altogether.
4.1.1.2 Option – Determine whether Additional Data Changes Risk Assessment Results
When data gaps are identified, ask “Would additional data likely change the conclusions of the risk assessment and affect the risk managementThe process of identifying, evaluating, selecting, and implementing actions to reduce risk to human health and to ecosystems. The goal of risk management is scientifically sound, cost-effective, integrated actions that reduce or prevent risks while taking into account social, cultural, ethical, political, and legal considerations (Commission 1997a). decision?” Uncertainty is inherent in data collection and risk assessment; additional data collection does not eliminate all uncertainty. Also, while some types of uncertainty may be acceptable to team members, this uncertainty may not be acceptable to all stakeholders.
Sampling results should be reviewed as soon as possible to determine whether the data meets the objectives and is sufficient to appropriately characterize the risk. If data gaps are identified, then managers must decide whether the data gaps are significant and if additional data should be collected, while keeping in mind the uncertainty inherent in data collection. In order to make this decision, ask the following questions:
- Does sufficient data exist to effectively estimate the risk posed by chemicals in environmental media?
- Will additional data help support a better decision?
- Depending on the chemicals in environmental media and analytical methods, do funding limitations affect the collection of additional data? For example, dioxin analyses are relatively expensive compared to heavy metals analysis.
Ultimately, data are collected and evaluated until additional samples result in minimal gain in understanding of the site. The key decision metric is whether additional data would likely alter the risk assessment and subsequent risk management decisions.
4.1.2 Issue – Addressing Permanent Data Gaps
Permanent data gaps are data gaps that cannot be resolved. These gaps can be the result of lack of information concerning the site history, future land uses, or site-specific sampling information. For some investigations, data gaps in sampling information may exist because areas of the site are inaccessible. Sites may be inaccessible, for example, because a property owner has refused right of entry, sampling locations are too close to sensitive areas such as utilities, or unstable conditions such as severe slopes exist. Depending on the type of site, nature of the data gap, and concentrations of chemicals in environmental media, permanent data gapsData gaps that cannot be resolved due to lack of information such as lack of information concerning the site history, future land uses, or from site-specific sampling information. associated with concentrations of chemicals can be handled in several ways.
4.1.2.2 Option – Assume the Concentrations Present
Assume a certain concentration of a chemical exists in an environmental mediumSoil, surface water, groundwater, indoor air, outdoor air, sediment, and other parts of the environment that may be impacted by the release of a chemical. over the area for use in the risk assessment. This concentration might be the maximum assumed concentration based upon historical data or data from surrounding areas, or a modeled concentration. Note that this option should be addressed in the planning stages and may not be accepted by all regulatory programs.
4.1.2.3 Option – Identify a Secondary Exposure Area
Develop a secondary exposure area and pathway that separately evaluates the area where data gaps exist, with some type of remedial action goal agreed upon by all stakeholders. Note that this option should be addressed early in the planning stages and may not be accepted by all regulatory programs.
4.1.2.4 Option – Conduct Long-Term Monitoring
Place the site in a long-term monitoring program to verify that site conditions have not changed (such as change in property ownership or change in land use) and that assumptions are still valid until further investigation can be conducted. The long-term monitoring is then documented in some form of land use plan, engineering control, or deed restriction.
4.1.2.5 Option – Use Professional Judgment
For data gaps resulting from missing historical or current site information, assumptions can be made using professional judgmentDecisions made based on knowledge gained through education and experience. based on information from similar sites with similar problems.
4.2 Data Usability
Data used for risk assessment must be validated to ensure that data are usable, in some cases requiring a third-party independent reviewer. The USEPA offers guidance (Chapter 5 of USEPA 1989a) on data evaluation necessary for risk assessment. Part of this data evaluation includes an assessment of data usability. Data usability is determined based upon certain QA/QC criteria. These QA/QC criteria include sampling and preservation requirements, detection limit adequacy, laboratory and matrix spike recovery accuracy and precision, and evaluation of blanks. Establishing appropriate QA/QC criteria is an important consideration during the project planning phase and, ideally, should be determined before samples are collected and analyzed. Numerous data QA/QC criteria guidance resources are available, such as USEPA’s Data Quality Assessment, USEPA’s National Functional Guidelines (USEPA 2008b; USEPA 2010e; USEPA 2011h), Department of Defense Quality Systems Management (DOD QSM), as well as other federal and state guidance (USEPA 2006b; USDOD 2013).
For many sites, historical analytical data may be decades old. Selecting the data to use in a risk assessment depends on various factors, including the media being evaluated, the chemicals of concern, and whether newer data exist from the same location. For example, older data from a groundwater monitoring well may be used to examine trends in the data; however, data from only the last few years would be used to evaluate current conditions. The elimination of any data for risk assessment purposes should be based on whether newer and more representative data are available. Generally, data should not be eliminated unless better information is available, or the data are clearly unusable.
Evaluation criteria within the various guidance documents differ slightly regarding specific method detection or quantification limits, and the review criteria selected for use should be determined. The data usability evaluation should be conducted by someone qualified and familiar with the DQOs for the site and data evaluation procedures. Data with QA/QC deficiencies may still be used in a risk assessment, but must be qualified accordingly and its effect on the risk assessment clearly communicated. For example, results in which a chemical is positively identified, but the concentration is estimated (J-qualified), may be biased low if the surrogate recovery was low and could result in underestimate of risk. The data evaluation process determines whether data is usable for calculating risk estimates. Data that is unusable for calculating the risk estimates still may provide useful information for determining the distributionA distribution describes the probability or likelihood of any potential value. of chemicals in environmental media or identifying further sampling locations.
Laboratory results should also be checked to make sure they have been corrected for the percent moisture (in the case of soils), lipid content, or dilutions. The following issues should be evaluated to ensure data usability during the data validation process.
4.2.1 Issue – Presenting Measurement Units and Significant Figures
A number of issues arise with units and significant figures used for reporting laboratory data.
4.2.1.1 Option – Confirm that Consistent Units are Presented
Analytical results are not always reported in the same units as the screening values to which they are compared. Ideally, analytical data should be reported in the same units as the criteria that they are compared to, with applicable correction factors applied. For example, air measurements may be in parts per billion or mg/m3. In this instance, conversion from one unit of measurement to another depends on the temperature, atmospheric pressure, and molecular weight of the compound. Several online conversion applications are available to help with conversions, such as one developed by the Center for Disease Control (CDC 2014). Laboratory data packages, reports, tables, and figures should be checked against each other to make sure that the units used to report the data are consistent across the report. A mistake in units can result in order-of-magnitude data errors. Many measurement unit issues can be avoided by simply limiting the manual creation of data tables and conversion of units.
4.2.1.2 Option – Identify Significant Figures
Numerical rounding and the use of significant figures can also affect data usability. Significant figures reflect the accuracy and precision of a given result. A result should always be rounded to the number of significant figures that are consistent with the confidence that can be placed on it. When comparing two sets of values (for example, detected concentrations to screening values), comparisons should be made with consideration of the significant figures provided and appropriate rounding applied. For example, if the screening value is 10 mg/L and the detected concentration is 10.2 mg/L, the detected concentration does not exceed the screening value.
4.2.2 Issue – Determining Cross-Contamination
In order to determine its usability for risk assessments, site data should be evaluated for possible contamination that is the result of the field sampling or laboratory processes. To evaluate sample data for cross contamination, several types of blank sample analyses can be used along with the site samples, including laboratory blanks, trip blanks, and rinsate/equipment blanks. Site data may be either accepted for the risk assessment or rejected based on any detections reported in the blank analyses.
4.2.2.1 Option – Review Laboratory Contamination and Method Blanks
Analytical laboratories use both method and instrument blanks to demonstrate that no laboratory sources of contamination exist. Laboratory blank contamination can be determined by a qualified analytical chemist, who reviews the laboratory data report and evaluates the laboratory method and instrument blanks for any detection of target compounds. If detections are noted in the laboratory method blanks, then these compounds are qualified (flagged) and any samples that contain the same compounds are flagged as well. Data usability depends on the relative concentrations of the compound detected in the method blank and the site sample result. If a site-related chemical is detected in a field or laboratory method blank, then the effects of the blank concentrations on the sample concentrations (biased high) should be mentioned in the risk assessment report.
Note that some organic chemicals commonly used in the laboratory may cross-contaminate project samples during the analytical procedure. The USEPA recognizes acetone, 2-butanone, methylene chloride, toluene, and phthalate esters as common laboratory contaminants (Chapter 5, USEPA 1989a). Although they are recognized as common laboratory contaminants, positive results for these compounds in project samples should not be dismissed without verifying appropriate blank contamination. If these chemicals are not found in the laboratory blanks, then they should be assumed to be site related. The USEPA provides guidance on evaluating laboratory method blanks (Chapter 5, USEPA 1989a) and guidelines for evaluating blanks are also included in the USEPA National Functional Guidelines for Inorganic (USEPA 2010e) and Organic (USEPA 2008b) Data Review, but other criteria may be considered in the project planning.
4.2.2.2 Option – Review Field Blanks and Trip Blanks
Field blanks are used to assess contamination associated with ambient field conditions. Trip blanks are analyzed for volatiles to assess potential contamination introduced during the field handling and shipping. An appropriate number of field method blanks and trip blanks should also be collected and analyzed for each medium and suite of analytes. A trip blank is required for each sample shipment container containing samples for volatiles analysis. Guidelines for evaluating these blanks are also found in the USEPA National Functional Guidelines for Inorganic and Organic Data Review (USEPA 2010e; USEPA 2008b).
4.2.2.3 Option – Review Rinsate and Equipment Blanks
Rinsate and equipment blanks are used to assess the adequacy of field decontamination processes and whether cross contamination may have occurred from one sampling site to another. The Quality Assurance Project Plan (QAPP) should detail the rinsate/equipment blank acceptance criteria for determining contamination effects on site data usability. If rinsate blank levels violate the acceptance criteria established in the QAPP, then investigate the source of contamination. If possible, the source should be eliminated (NJDEP 2004). Re‐sampling and re‐analysis may be required.
4.2.3 Issue – Assessing Data Representativeness
The USEPA defines representativeness as a data quality indicator of the degree to which data accurately and precisely represents a characteristic of a population (USEPA 2006c). This indicator answers the question: “Are the samples representative of actual site conditions?”
4.2.3.1 Option – Review Data Representativeness Components
The data collection program should be designed so that the samples collected from each medium at a site reflect the environmental conditions of the site and the parameter that is to be measured. In determining the number of samples collected for each medium, consider the size of the site, the exposure area for each receptorAn individual (for example, residential adult, residential child, worker, trespasser, or recreator) who has the potential to be exposed to a chemical in environmental media., and the feasibility of the sampling design rationale. For instance, groundwater samples collected adjacent to a source area may not adequately represent an entire aquifer from which people may drink. Rather, results from individual drinking-water wells might better represent exposure. Insufficient sampling may not adequately represent the spatial and temporal variabilityA population’s natural heterogeneity or diversity, particularly that which contributes to differences in exposure levels or in susceptibility to the effects of chemical exposures (Commission 1997a). For example, workers may perform different functions that may affect time, frequency, and duration of contact with an environmental medium). Variability cannot be reduced by collection of additional data. in site conditions and therefore not represent real site conditions.
Representativeness also depends on proper sample collection and laboratory analysis of samples. Sampling and preservation methods used for each medium can affect results. For instance, sampling volatiles in groundwater using a bailer may not adequately represent true groundwater concentrations because of the inherent loss of volatiles as the bailer is lowered, raised, and emptied. Likewise, if samples are not properly preserved, their integrity may be compromised and resulting data may not represent accurate site concentrations. Factors such as the selection of sampling schemes (for example, discrete, composite, multi-incremental), use of groundwater data from temporary monitoring wells, and use of filtered versus total groundwater results should be addressed in the project planning phase. Not all data may need to be incorporated into the risk assessment; however, justification for the data that are included or excluded from the evaluation should be documented.
Representativeness may also be compromised by laboratory sampling and subsampling variability. For instance, if a laboratory analyst preferentially selects an aliquot from the environmental sample collected, then the results may not adequately represent site conditions. Representativeness may also be affected by analytical precision and accuracy or data quality qualifications. If data are qualified because of low surrogate recovery, then the measured chemical concentration reported may be biased low. See Section 3.3 for information on developing the data collection program.
4.3 Data Reduction Concerns
Data reduction is an early step in evaluating the data used to develop a risk assessment. Reduction involves the processing of data produced by the analytical laboratory to create a data set that can be used to assess human health risks. The data set is then used to generate maps or other visual aids to understanding risk, summary statistics, statistical graphics (for example, box plots or histograms), and to perform statistical analyses. Data reduction activities may include handling of duplicate sample analyses; merging of data generated from more than one sampling event, sampling method, or analytical method; and the organization of the data.
The risk assessment report should provide a thorough discussion of data reduction methods. The product of the data reduction is a data set organized and formatted in a way that facilitates statistical analysis and visualization (for example, mapping).
4.3.1 Issue – Using Duplicate Samples
Different types of duplicate samples indicate precision in analytical measurements. Colocated field duplicate samples are collected in the field analysis and laboratory duplicate samples are collected from the same prepared sample. The number of colocated duplicate samples should be defined as part of the data collection program.
4.3.1.1 Option – Identify the Number of Duplicate Samples
The rule of thumb is to collect duplicate samples equal to 10% of the total number of samples for each medium and each analysis. The protocols used for the laboratory duplicate samples (number and frequency) are generally outlined in the analytical laboratory’s quality control plan (see Section 3.3.1.2).
4.3.1.2 Option – Determine How to Handle Duplicate Data
Primary and duplicate samples may be handled by one of the following methods:
- averaging the results for each analyte in the two samples
- retaining only the greater or lesser of the two analyte results
- simply treating the duplicate as a QA/QC sample while ignoring it in the risk assessment
Handling of duplicate data should be determined during the project planning phase.
4.3.2 Issue – Pooling Data
To generate a data set that is more representative of temporal or spatial variability in site conditions, or both, it may be useful to pool or combine data. These data may have been generated by different analytical methods, collected at different times, collected at different locations (for example, pooling data from a group of groundwater monitoring wells), collected by different organizations, or collected for different purposes.
4.3.2.1 Option – Consider How to Pool Data
Data can be successfully pooled if the analytical methods and detection limits are similar. Otherwise, each data set should be pooled on a case-by-case basis and qualified if the analytical methods are different. In these cases, develop and clearly document the pooling method so that the integrity of the data is not compromised. For example, method detection limits have significantly improved over time for some methods, thus it is inappropriate to pool older data (with higher detection limits) with more recent data (which has much lower detection limits). Spatial and temporal variability should be carefully considered prior to pooling data. If the older data show a detected concentration of a chemical, then those data are potentially useable. If the laboratory method detection limit is below the desired detection limit, then these data could also possibly be used. If the laboratory method detection limit for the older data is higher than the desired detection limit and concentrations of a chemical are not reported above the method detection limit, then these results may not be appropriate for use in pooled data. Finally, inconsistencies in sample collection may also prohibit the pooling of data; for example groundwater volatiles samples collected using a bailer would not be pooled with data from samples collected using low flow sampling methods.
4.3.3 Issue – Handling Flagged Data Concentrations
Some laboratory analyses generate concentration measurements that are below the laboratory detection limits (for example, method detection limit or reporting limit; see Section 5.7.1, ITRC 2013. Concentrations reported at less than detection limits are called “censored” or “flagged” data. In addition, during the data validation process, data are validated for compliance with the analytical method requirements and data qualifier “flags” are applied to the data to indicate QA/QC issues to consider when using the data.
4.3.3.1 Option – Review Flagged Data
Flagged data can provide valuable information (such as the presence of a chemical between the method detection limit and the reporting limit), and the approach to handling these data points can change the outcome of a risk assessment. For example, if a chemical is present below the reporting limit and is flagged with a “J” qualifier (indicating an estimated concentration), the estimated concentration could be used when calculating the EPC for the chemical. In addition, if data qualifiers indicate that some data are biased high or low in concentration, this information may be useful in decision-making for the site, especially when risk estimates are close to a decision-making criterion (unacceptable risk level). The risk assessment report should provide a discussion of the handling of flagged data sufficient to inform the reviewer as to whether these data have been included and how their use affects the outcome of the risk assessment.
4.3.4 Issue – Handling Nondetect Concentrations
Often, reportable concentrations do not occur for a chemical reasonably expected to be present in the environmental media. These data are referred to as “nondetects.” Nondetects provide valuable information, and the approach to handling nondetects can change the outcome of a risk assessment. Several methods may be considered for handling nondetect data.
4.3.4.1 Option – Use Simple Substitution
Simple substitution (for example, 0, one-half the detection limit, or the detection limit) for nondetects may be done for point-by-point comparisons when data sets are relatively small (for example, less than 10). Using simple substitution, if nondetect results for a chemical are reported at detection limits less than a screening value, then the chemical may be confidently eliminated from further consideration in the risk assessment. If detection limits are greater than the screening values, however, a chemical may not be eliminated with confidence from further consideration. Section 4.5.4 discusses handling nondetects in screening.
4.3.4.2 Option – Use Other Methods
Other methods of handling nondetect results may be applicable based upon the data distribution. The handling of nondetects should be discussed during project planning, and the risk assessment report should provide a discussion sufficient to inform the reviewer about how the nondetects affect the outcome of the risk assessment. Section 1.11 of the User Guide for ProUCL Version 5.0 (USEPA 2013e), Environmental Statistics (USACE 2013), and Section 5.7 of ITRC’s guidance (ITRC 2013) identify various ways to handle nondetects in data sets.
4.3.5 Issue – Considering Outliers
Outliers are extremely large (or small) measurements relative to the rest of the data in a data set and have the potential to misrepresent (bias) the population from which they were collected. For additional information about outliers in environmental data, see ITRC 2013 and USEPA 2010c.
4.3.5.1 Option – Consider Sources of Outliers
Outliers may arise from matrix interferences or errors in transcription, sampling technique, data-coding, analytical methods, or instrument calibration. Alternatively, data that appear to be outliers may simply represent inherent variability in a data set. This case is particularly true for metals when soil and sediment composition and geochemistry are heterogeneous. For example, at former small arms firing ranges where lead fragments may be present in soil samples, analytical results for samples containing these lead fragments may be significantly higher than for other samples. These samples may appear to be outliers in a phenomenon known as the “nugget effect,” although these samples would still be part of the overall data set. On the other hand, apparent outliers may also represent observations from true hot spotsHot spots are considered to be soil volumes with relatively high concentrations that could be present at a site but whose locations and dimensions cannot be anticipated prior to sampling (ITRC 2012a). on the site.
When outliers are not identified and removed from data sets, they can disproportionately affect the statistical descriptors of the data set. That is, the mean can be biased toward the direction of the outliers and artificially increase data variability and standard deviation. Outliers can result in impractically large (or small) and unstable upper confidence levels (UCLs), flawed statistical testing, and erroneous conclusions.
4.3.5.2 Option – Identify Outliers
Statistical outlier tests can be performed to determine whether some data points are considered outliers, but visual observation of the data is also recommended. Apparent outliers can be identified (ITRC 2013; ASTM 2008b) and, if appropriate, additional sampling may be warranted. The handling of outliers should be included in the planning for the risk assessment project (see Section 3.3.3) and clearly discussed in the report.
4.3.6 Issue – Addressing Tentatively Identified Compounds
Laboratories calibrate for a specific target analyte list based on the analytical method or upon request, and only those analytes are reported quantitatively. Tentatively identified compounds (TICs) are nontarget chromatographic peaks detected during gas chromatography/mass spectrometry (GC/MS) analysis. TICs may be qualitatively identified by searching the National Institute of Science and Technology (NIST) (NIST 2014) or similar mass spectral library. Estimated concentrations for TICs are calculated similarly to the target compounds. These estimated concentrations, however, should not be used in calculating risk. Thus, target analyte lists should be reviewed to ensure that chemicals actually used at a site are included on the analyte list, even if those chemicals may not be found on common target lists.
4.3.6.1 Option – Confirm TICs
A TIC typically is eliminated from further consideration unless a potentially high concentration is revealed in the analysis and detected at an actual point of exposure (for example, in a water supply well sample) or the TIC is a chemical suspected to be associated with the facility but not on the standard analyte list.
If a TIC is to be considered for use in risk assessment, it must be evaluated quantitatively (similar to how the target analytes are confirmed against a known calibrated standard). USEPA (2006f) notes that "if the TIC is only identified as a particular class of compounds, then the laboratory will need to conduct further investigations to determine the identity of that particular compound." Knowing only the class of compounds present, however, may be useful in site decisions.
4.3.7 Issue – Assessing Nonspecific Methods
Data from nonspecific methods such as those used to assess certain classes of chemicals (for example, petroleum hydrocarbons, PCBs, and certain metals such as chromium and mercury) can be problematic in risk assessment:
- Bulk petroleum hydrocarbons are typically divided into various hydrocarbon ranges, with each containing hundreds of constituent chemicals, but these ranges are not defined consistently between regulatory agencies.
- PCBs may be reported as total PCBs, specific congeners, or Aroclors, which can create confusion as to how to quantify risk. Agencies may dictate how PCB data are reported and risks calculated.
- Chromium is typically reported as total chromium, which includes both trivalent and hexavalent chromium (Cr+3and Cr+6).
- Mercury is reported as total mercury, which includes both inorganic and organic (methylmercury) forms. Each has its specific associated toxicity valuesDerived values (for example, reference doses and slope factors) that can be used to estimate the incidence or potential for adverse human health effects in receptor (USEPA 2015h)., but which to use and how to assess risk are often an issue.
4.3.7.1 Option – Incorporate Nonspecific Methods Data
The need for, and specific analytical approach to, nonspecific methods should be discussed during project planning and documented in the sampling plan.
If petroleum hydrocarbon fraction data are used in the risk assessment, avoid overestimating risk by double-counting concentrations for components of the mixture that are also included in chemical-specific analyses (for example, benzene included in a specific carbon range and as a separate analyte). An example of the use of hydrocarbon ranges is presented in USEPA guidance (USEPA 2014e).
The reporting and use of PCB data components in the risk assessment should be defined during the planning stage. Some agencies prefer Aroclor analyses for all media, while others require congener-specific analyses for fish and other biota samples. Some older data may be reported as “total PCBs” only, with no Aroclor analyses. When Aroclor analyses are conducted, “total PCBs” can be calculated per sample (based on the sum of Aroclors) used in the data screening step.
The specific form of chromium to be reported and assumed in the risk assessment should also be defined during project planning. One approach could be to assume that all of the total chromium concentration is in the more toxic Cr6+ form and therefore require use of Cr6+ toxicity values to estimate chromium risk. Alternatively, the predominant form of chromium expected to be present at the site may be assumed, or a ratio of Cr3+ to Cr6+ may assumed, or analytical speciation may be performed to generate concentrations for each chromium species individually for use in the risk assessment.
The specific form(s) of mercury to be reported and assumed in the risk assessment should be identified. Depending on the site history, medium sampled, and environmental setting, it may be appropriate to assume one form over another, or it may be appropriate to analyze samples from selected media for methylmercury.
4.4 Data Visualization and Analysis
Data visualization and data analysis generally include the use of tabular, graphical, spatial, and statistical tools to:
- understand the magnitude of a chemical release, the location and migration of the release, the affected environmental media, and the exposure pathways;
- test hypotheses about data quality and site conditions (for example, mapping data can help assess the completeness of the data set);
- highlight shortcomings in common risk assessment assumptions (for example, a potential receptor cannot be simultaneously exposed to the maximum concentrations of two different chemicals if those chemicals occur in different locations); and
- communicate complex technical details about site conditions and management options.
4.4.1 Issue – Accurately Displaying and Visualizing Data
Data visualization reveals site-specific patterns that might not otherwise be observed in a report or a tabular summary of data.
4.4.1.1 Option – Use Common Data Visualization Tools
Maps and figures displaying site data are typical formats for data visualization to explain the magnitude of a release, the location and migration of that release, the affected environmental media, and the exposure pathways. Statistically derived visualizations can help test hypotheses about data quality and site conditions. Common data visualization tools are presented in the Table 4-1, Figure 4-1, Figure 4-2, and Figure 4-3. For more information about the visualization tools, see ITRC and USEPA resources (ITRC 2013; USEPA 2010c; USEPA 2013e).
|
Method |
Benefits |
Shortcomings |
|---|---|---|
|
Box plot (see Figure 4-1) |
Nonparametric Visual display of variability Outlier identification Provides summary statistics (for example, mean, median, quartiles) |
No spatial information No temporal information Can lead to incorrect interpretation of data depending on scale of box plot |
|
Histogram (see Figure 4-2) |
Estimates the probability distribution of a data set |
No spatial information No temporal information No summary statistics |
|
Probability plot (quantile plot; see Figure 4-3) |
Outlier identification Distribution identification |
No spatial information No temporal information No summary statistics |
|
Two-dimensional map |
Provides spatial information Informs the CSM |
Must be designed specially to present temporal information No summary statistics |
|
Scatter plot |
Provides temporal information (for example, concentration trends over time) |
No spatial information No summary statistics |
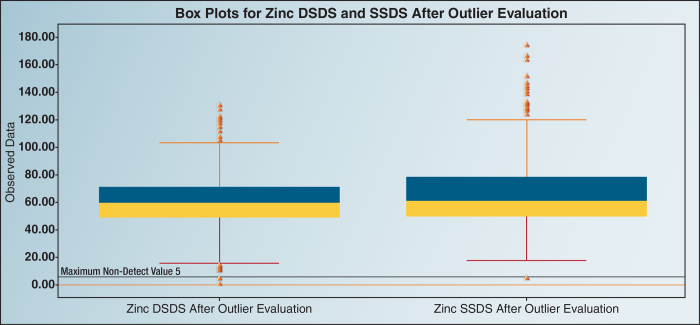
Figure 4-1. Box plot example developed using USEPA’s ProUCL statistical software package.
Source: Data from Bradford et al. 1996 and Solt 2010.

Figure 4-2. Histogram example developed using USEPA’s ProUCL statistical software package.
Source: Data from Bradford et al. 1996 and Solt 2010.
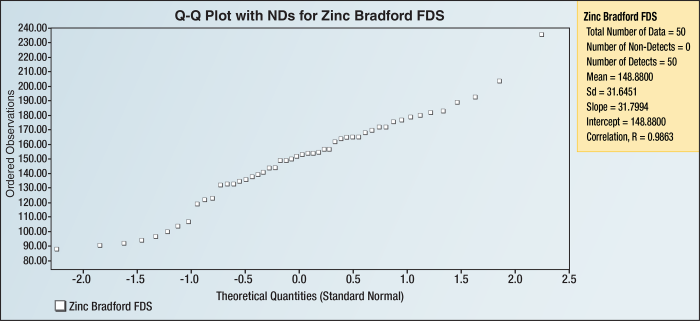
Figure 4-3. Q-plot example developed using USEPA’s ProUCL statistical software package.
Source: Data from Bradford et al. 1996 and Solt 2010.
4.4.2 Issue – Statistically Analyzing Data
Agencies may have specific guidance, policy, or regulations about statistical approaches. Statistical analysis may require one or more of the following:
- quantitative evaluation of the central tendency in a data distribution (for example, mean or median concentrations)
- evaluation of the upper and lower bounds on that distribution (for example, upper or lower prediction limits, tolerance limits, confidence intervals, percentiles)
- identification of outliers (for example, data points that are unusually large or small as compared to the majority of the data points in a sample population)
- comparisons of concentrations of a chemical in environmental media to background concentrations
4.4.2.1 Option – Perform a Statistical Analysis
Performing a statistical analysis requires the selection of an appropriate statistical analysis method. A detailed discussion of the selection of an appropriate statistical analysis method is beyond the scope of this document. For a detailed discussion of the statistical analysis of groundwater data, please refer to ITRC’s groundwater statistics guidance (ITRC 2013). Additional publications that explain statistical evaluation of environmental data include the technical documentation and user’s guide published with USEPA’s ProUCL statistical software package (USEPA 2010c), the USEPA Unified Guidance (USEPA 2009b), and many other publications from commercial publishers. Additionally, guidance from NIST (NIST/SEMATECH 2012) is particularly useful for understanding exploratory data analysis.
4.5 Data Screening and Chemical Selection Processes
Risk assessment generally begins with a conservative step. Screening values (based on default assumptions as opposed to site-specific values) are used to identify areas and chemicals in environmental media warranting further evaluation and to assess the adequacy of sampling data collected (for example, whether the nature and extent of concentrations are adequately characterized). The subsequent steps typically use calculations or models and more site-specific exposure assumptions and intake variables. This screening approach allocates resources based on the apparent significance of the concentrations of a chemical and its presence in an environmental medium.
Screening values, intended to be protective of human health or the environment, are often defined as chemical concentrations in environmental media below which no additional regulatory action is warranted. Screening values can be based on estimates of excess lifetime cancer risk or adverse noncarcinogenic effects, typically whichever is most conservative, using equations combining exposure assumptions with toxicity data. As illustrated in Figure 4-4, if chemical concentrations at a site exceed the screening values, then additional investigation or evaluation (for example, by risk assessment) of that chemical is warranted but does not necessarily require cleanupThe assessment and reduction, removal, or control of chemicals in environmental media. Cleanup is synonymous with other terms such as "corrective action" and "remediation" used in various state, local, and federal programs. (ITRC 2005).
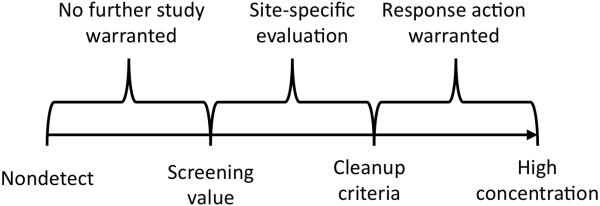
Figure 4-4. Risk-based decision process.
Source: Adapted from USEPA 1996b.
4.5.1 Issue – Identifying Appropriate Screening Values
There may be federal, state, or even local screening values that may apply to the site and that may differ. Additionally, there may be more than one screening value for a single chemical in a given medium to address multiple exposure scenarios. For example, based on current and reasonably anticipated future land use, chemicals may need to be compared to both residential and nonresidential screening values. In another example, for CERCLA sites, CERCLA Section 121(d) stipulates that applicable or relevant and appropriate requirements (ARARs) be met, meaning that levels must be applicable to the site, or relevant and appropriate to the chemical or contaminated media at the site.
A survey of 13 state agencies about their methodology for determining risk-based concentrations and establishing standards for chemicals in soil and water noted that:
“…it is evident that there is variability in each agency’s basis and intended use of screening values…published screening values for a chemical can differ from state to state by several orders of magnitude…” (ITRC 2005).
This variability in screening values is the result of the exposure assumptions, fate and transport approaches, and risk management targets used to calculate the various screening values. In addition, some screening values may not be derived using risk-based approaches, but instead be based on other factors such as laboratory quantification limitations or on concentrations of chemicals found naturally at background concentrations in the environment. The latter two factors are not risk-based or health-based screening values.
4.5.1.1 Option – Select Applicable Screening Values
Screening values to be used should be identified and documented early in the planning stage. Overall, the screening values chosen should be consistent with the assumptions outlined in the CSM and the regulatory framework in the jurisdiction in which the site exists. One value may be selected over another or the chemicals could be compared to each of the available regulatory screening values. The regulatory agency hierarchy as discussed in Section 3.1.3.1 may dictate which screening value is used.
Screening values may change over the course of the project. Screening values may be revised based on new toxicology studies, better understanding of site conditions, changes in exposure assumptions, or revised laboratory analytical methods. The project planning team should plan for a response if screening values change after the data has been screened and the risk assessment performed.
4.5.2 Issue – Identifying Chemicals for Evaluation in the Risk Assessment.
Although the screening values may differ among agencies, the initial screening evaluation (typically part of a Tier 1 evaluation) is generally well-defined and consistent. Typically, “the number of chemicals to be considered during the remainder of the risk assessment will be less than the number of chemicals initially identified” (USEPA 1989a).
4.5.2.1 Option – Select Chemicals for Further Evaluation
Chemicals detected at concentrations above the screening values are retained for further evaluation. Chemicals detected below screening values may be handled as follows:
- considered as having minimal influence on total risk and not retained in the quantitative risk assessment
- may be further evaluated and retained based on the toxicity, mobility, and persistence of a chemical
- considered essential nutrients (such as calcium, magnesium, potassium, and sodium) and not retained in the quantitative risk assessment
- further evaluated considering the frequency of detection (for example, chemicals detected at a frequency of less than 5% and not detected in multiple media may be eliminated from further consideration) and eliminated from further consideration
The approach for handling chemicals detected above and below the screening values should be discussed and resolved during the planning process, and the rationale for not retaining chemicals for further evaluation should be documented.
4.5.3 Issue – Addressing Chemicals that are Missing Screening Values
In the chemical screening step, analytes are often missing screening values. In some cases, these values are missing because toxicity or other data necessary to calculate a screening value are lacking. In other cases, toxicity data may be available, but a screening value has not been developed.
4.5.3.2 Option – Use a Surrogate
For chemicals that do not have screening values or data to calculate screening values it may be appropriate to identify surrogate chemicals with available screening values. Typically, chemicals with screening values for other isomers of the same chemical are used; for example, the level for cumene could be substituted for butylbenzene. Section 5.1.2.3 provides further guidance on the use of surrogates.
4.5.3.3 Option – Eliminate Chemicals without Screening Values
If screening values are not available, a chemical can be eliminated from further assessment if it is not related to site operations or to a release from a site (for example, it is an essential nutrient; see Section 5.9.4 of USEPA's guidance [1989a] for additional information on essential nutrients), or if the chemical may otherwise be qualitatively assessed.
4.5.4 Issue – Handling Nondetect Chemicals in Screening
When samples are analyzed for extended lists of analytical parameters, typically a fairly large group of chemicals are identified as nondetects in all samples. Sometimes the applicable regulatory context dictates the treatment method for nondetects in the screening process. When the regulatory context does not dictate the approach, however, several methods are used to evaluate nondetects in the screening step.
4.5.4.1 Option – Exclude from Further Evaluation in the Risk Assessment
Where the analytical results for a particular chemical are all below the laboratory analytical detection limit and the detection limit is below the screening value, the chemical can be eliminated from further consideration in the risk assessment.
If a sample-by-sample comparison of the detection limit to the screening value indicates a low frequency of detection and the detection limit is below the screening value, consider excluding that chemical from further consideration in the risk assessment. USEPA (1989a) recommends that a chemical be considered for elimination from a risk assessment
if: (1) it is detected infrequently in one or perhaps two environmental media, (2) it is not detected in any other media or at high concentrations, and (3) there is no reason to believe that the chemical may be present.
4.5.4.2 Option – Retain for Further Evaluation in the Risk Assessment
Where the analytical results for a particular chemical are all below the laboratory analytical detection limit and the detection limit (including flagged values) is above the screening value, then the chemical should be considered for further evaluation in the risk assessment (if the chemical is known or suspected to be related to a release on the site). These inadequacies in the analytical detection limit should be discussed as a source of uncertainty in the risk assessment. If the chemical is not known or suspected to be associated with a release, then the chemical may be excluded from the risk assessment (with the reason documented).
If the chemical is a degradation product of another chemical detected on the site, consider retaining the chemical in the risk assessment.
4.5.5 Issue – Addressing Data Bias in Screening Process
Data bias in the screening process can significantly affect risk assessment conclusions. Biases should be accounted for in the risk assessment.
4.5.5.1 Option – Identify the Type and Significance of Data Bias
The concentrations in the data set may be biased (high or low) for various reasons and thus not be representative of the entire exposure area. In some cases, environmental samples may have been collected from only the areas of the site with the highest concentrations of chemicals (thus the exposure areas concentrations may be biased high). In other cases, environmental samples may have been collected from only the periphery of the impacted area (thus the exposure area concentrations may be biased low). When a surrogate concentration (for example, the reporting limit) is used for a chemical that was a nondetect in the screening, the exposure area concentration for that chemical may be biased high. When the screening value for a surrogate chemical is used for an analyte missing a screening value, the bias in the screening, high or low, may be known (for example, when using hexavalent chromium to screen total chromium concentrations and hexavalent chromium is not expected to be present). If the bias in the data is expected to affect the remedial action decision for the site, then additional data collection may be needed to make a more informed decision (see Section 6.2.5).
4.5.6 Issue – Handling Background Concentrations
It is common for chemicals such as metals or polycyclic aromatic hydrocarbons (PAHs) to be identified at sites at concentrations higher than risk-based screening values due to naturally occurring or non-site-related anthropogenic conditions. Most state and federal remedial action programs do not require remediation of impacts below background or in some cases only require remediation to address site-related impacts.
Some states may have published or unpublished approaches for comparisons of site and background data sets. Various references are available providing approaches for comparison to background (for example, DTSC 1997, DTSC 2008, DTSC 2009b, and DTSC 2009a).
If limited background data are available, then the background screening may be performed by using a point-by-point comparison or by comparing the maximum detected site concentrations to a background value (see Section 3.3.7 and Section 6.2.5).
4.5.6.1 Option – Use Site-Specific Background Data
For some sites, a large and site-specific background data set may exist and background screening can be performed using a statistically derived background number or using a statistical test to determine whether the background data and the site data are from the same population. The availability of agency requirements for establishing site-specific background concentrations should be determined (for example, DTSC 2008).
4.5.6.2 Option – Use Background Data from Other Sources
In some cases, applicable regional background data may be available from other sources. This data may have been collected as part of studies for unrelated sites such as preconstruction environmental assessment studies, monitoring programs (drinking water, landfill monitoring), or research studies. These sources should be explored to determine the availability of applicable background data.
4.5.6.3 Option – Use Background Values Collected From General Background Studies
Some states and agencies have published or unpublished background values collected as part of state-wide projects that can be used for comparison to site data (for example, Boerngen and Shacklette 1981, Gustavsson et al. 2001, Shacklette and Boerngen 1984, and USGS 2012).
4.6 Resources and Tools
The following resources and tools were not cited in the sections above and are included here for further information.
Spatial Analysis and Decision Assistance (University of Tennessee 2013)
ProUCL software (USEPA 2013d)
Drinking Water Standards (USEPA 2014c)
Preliminary Remediation Goals for Radionuclides (USEPA 2014i)
Regional Removal Management Levels for Chemicals (USEPA 2014k)
Risk Assessment Information System, Oak Ridge National Laboratory (ORNL 2014)
Using the Triad Approach to Streamline Brownfields Site Assessment and Cleanup – Brownfields Technology Primer Series (USEPA 2003f)
Publication Date: January 2015