5.3 Tolerance Limits
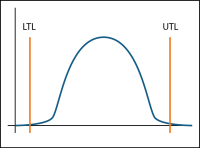
Tolerance intervals are statistical ranges typically constructed from on-site backgroundNatural or baseline groundwater quality at a site that can be characterized by upgradient, historical, or sometimes cross-gradient water quality (Unified Guidance). data. Tolerance limits define the rangeThe difference between the largest value and smallest value in a dataset (NIST/SEMATECH 2012). of data that fall within a specified percentage with a specified level of confidence. The upper tolerance limit has been commonly used to establish a background threshold value, however, prediction limitsIntervals constructed to contain the next few sample values or statistics within a known probability (Unified Guidance). are often favored for establishing a background threshold value in groundwater because they account for repeated measures. An upper tolerance limit (UTL) is designed to contain, but not exceed, a large fraction (that is, 95%, 99%) of the possible background concentrations, thus providing a reasonable upper limit on what is likely to be observed in background. Similarly, the lower tolerance limit (LTL) is designed to contain at most a certain percentage of the possible background concentrations, thus providing a reasonable lower limit on what is likely to be observed in background. The fraction to be contained or ‘covered’ by the limit is the coverage parameter, and must be specified along with a desired confidence levelDegree of confidence associated with a statistical estimate or test, denoted as (1 – alpha) (Unified Guidance).. Tolerance limits explicitly account for the degree of variation in the background population and the size of the sample of measurements used to construct the limit. Table F-2 includes information about checking assumptions for Tolerance limits. Tolerance limits and confidence limits (see Section 5.2) are distinct, even though in some cases the one-sided upper limits for both methods are equivalent.
- Tolerance limits can be used to represent the typical upper end of background concentrations (background upper tolerance limit).
- In compliance monitoring and corrective action (where allowed), a tolerance limit may serve as an alternate compliance limit (ACL) when no published compliance limit (for example, a maximum contaminant level (MCL) exists).
- Study Question 2: Are concentrations greater than background concentrations?
- Study Question 3: Are concentrations above or below a criterionGeneral term used in this document to identify a groundwater concentration that is relevant to a project; used instead of designations such as Groundwater Protection Standard, clean-up standard, or clean-up level.?
- Parametric tolerance limitsThe upper or lower limit of a tolerance interval (Unified Guidance). assume the data follow a statistical distribution – typically normal (or can be normalized). If a transformation (for example, computing the logarithms of all of the data points is a transformation) is needed to normalize the measurements, the tolerance limit can be computed using the transformed values and then back-transforming the results to get the final limit.
- Nonparametric tolerance limits do not assume normality or any particular distributional form (but generally require larger samples sizes than parametricA statistical test that depends upon or assumes observations from a particular probability distribution or distributions (Unified Guidance). tolerance limits).
- Tolerance limits assume the population is stable (or stationaryA distribution whose population characteristics do not change over time or space (Unified Guidance).) over the period of time during which measurements are collected. No obvious trends or temporal patterns should exist in the background data.
- Since tolerance limits typically involve interwellComparisons between two monitoring wells separated spatially (Unified Guidance). comparisons, their use in detection monitoring tests assumes minimal spatial variabilitySpatial variability exists when the distribution or pattern of concentration measurements changes from well location to well location (most typically in the form of differing mean concentrations). Such variation may be natural or synthetic, depending on whether it is caused by natural or artificial factors (Unified Guidance)..
- Tolerance limits assume that the measurements are independent.
- Comparison of compliance data against an upper tolerance limit assumes that the two populations being compared have similar variances. This condition can be assessed using a homogeneity of varianceThe square of the standard deviation (EPA 1989); a measure of how far numbers are separated in a data set. A small variance indicates that numbers in the dataset are clustered close to the mean. test, but will be difficult to test directly unless you have at least four independent observations from each population (background and compliance).
- Use of a minimum of 8 to 10 values is recommended, a larger data set may be required if data are skewed or contain nondetectsLaboratory analytical result known only to be below the method detection limit (MDL), or reporting limit (RL); see "censored data" (Unified Guidance)..
- When using a parametric tolerance limit, test the normality of the original measurements or find a transformation that normalizes the data.
- When using a parametric tolerance limit, compute the sample meanThe arithmetic average of a sample set that estimates the middle of a statistical distribution (Unified Guidance). and standard deviation.
- When using a nonparametricStatistical test that does not depend on knowledge of the distribution of the sampled population (Unified Guidance). tolerance limit, rank the values.
- Check for temporal correlationAn estimate of the degree to which two sets of variables vary together, with no distinction between dependent and independent variables (USEPA 2013b). and the presence of temporal trends in the background data.
- If you suspect outliers, examine the background data using a probability plot, Dixon’s Test, Rosner’s test, or another appropriate method.
- Check for spatial variation before using tolerance limits for interwell comparisons used in detection monitoring.
- When constructing a parametric tolerance limit, you must pre-specify both a confidence level and coverage level. A coverage level is usually pre-specified for a nonparametric tolerance limit, but the achieved confidence level is computed after the fact based on the available sample size.
- High false positive rates can occur when a large number of comparisons are done. However, the selected confidence level can be increased to lower the false positive rateThe frequency at which false positive or Type I error occurs. The false positive rate, or α (alpha), is the significance level of a hypothesis test. If a test is at an α = 0.01 level of significance there would be a 1% chance that a Type I error would occur (Unified Guidance)..
- Lack of normality is not always a problem, since a nonparametric tolerance limit can be computed if the background data are not normal and cannot be normalized. However, you may need a larger sample size to achieve the desired coverage and confidence level targets.
- For parametric tolerance limits, see Section 5.7 for information regarding nondetects.
- If the population is not stationary over time, but instead the measurement levels are actively changing, the data used to construct a tolerance limit will be too variable and will tend to biasSystematic deviation between a measured (observed) or computed value and its true value. Bias is affected by faulty instrument calibration and other measurement errors, systematic errors during data collection, and sampling errors such as incomplete spatial randomization during the design of sampling programs (Unified Guidance). the limit on the high side (that is, it will be too large).
- If significant natural spatial variation exists, distinct well locations may exhibit substantially different levels independently of the presence of contaminants. In such cases, an interwell tolerance limit comparison may not answer the question: are there statistically significant differences from background levels attributable to groundwater contamination?
- If the measurements are not independent but instead positively correlated over time, the nominal degrees of freedomThe number of ways which members of a data set or data sets can be independently varied (Unified Guidance). will be too large, leading to parametric tolerance limits that are biased low and nonparametric limits that achieve less confidence (for fixed coverage) than the nominally stated level.
- A tolerance limit approximates an upper percentile of the background population and can be interpreted as such. For example, a 95% coverage upper tolerance limit approximates the population 95th percentile.
- Unlike prediction limits, tolerance limits can account for any number of future comparisons; however, a coverage level must be specified in place of the number of future comparisons.
- A tolerance limit on background can serve as an alternate criterion when background levels exceed published criteria.
- Tolerance limits are less flexible than prediction limits when incorporating formal retesting in detection monitoring.
- Nonparametric tolerance limits typically require a much larger sample size than parametric tolerance limits to achieve both a high coverage and high confidence level.
- Unlike prediction limits, a small percentage of true background values will tend to exceed a tolerance limit, at a rate equal to the complement of the coverage level (for example, 5% of the time for 95% coverage). As a result, greater uncertainty may exist in determining when an exceedance of a tolerance limit truly indicates a statistically significant difference from background levels.
Chapter 17.2.1, Unified Guidance discusses parametric tolerance limits and provides a sample problem (Example 17-3). Chapter 17.2.2, Unified Guidance discusses nonparametric tolerance. See Example 17-4, Unified Guidance for application of nonparametric tolerance limits.
Publication Date: December 2013