6. System Start-up, Operation, and Maintenance
Bioreactors used to treat MIW are generally designed for minimum operational maintenance, especially when located in remote areas. For example installation in a remote area where maintenance is difficult or unlikely can result in failure to provide treatment (see Appendix B.14, Lady Leith mine case study).
However, some level of operational controls and maintenance are necessary to achieve the performance expectations of the bioreactor and treatment system as a whole.
This section describes the following monitoring, operation, and maintenance activities:
- system start-up (Section 6.1)
- operation and monitoring (Section 6.2)
- maintenance (Section 6.3)
- sampling protocol (Section 6.4)
- content of an operation and maintenance plan (Section 6.5)
The monitoring section describes monitoring tools and techniques for the physical condition of the bioreactor, the system flow rate and water chemistry for operational performance, and water chemistry for regulatory compliance. The maintenance subsection includes substrateEither (a) a chemical which reacts or (b) a solid surface or (c) an electron donor./nutrient replacement, troubleshooting and preparation of an operation and maintenance plan.
6.1 System Start-up
Start-up should allow sufficient growth of the microbial populations to establish a stable biomass within the reactor unit. As described in Section 3, the source of the microbes often is from manure (Table 1-1), but may also come from any combination of laboratory designed inoculum, wastewater, anoxic site sediments, or source water (Gusek and Figueroa 2009; La et al. 2003; Perrault et al. 2009). Appropriate chemical and physical conditions are necessary to promote the growth of the desired microorganisms. The sulfate reducing bacteria require anoxic or very low dissolved oxygen levels, sulfate, and an organic carbon food source.
BCR Start-up
During a two week start-up, pumps recycled the water within the two BCR cells. Based on data collected in field, and subsequent laboratory confirmation, the water from the BCR cells was routed to the tailings pond for temporary storage and later treatment and release. At that point, the rock filter and aeration ponds were brought on-line. In the meantime, the mine discharged according to plan through an overflow pipe from the settling pond as it had during construction of the other components. See Appendix B.7 West Fork Mine Case Study for more details.
There are generally three phases of start-up:
- Reactor flooding
- Low-flow or recirculated flow operation
- Full-flow operation with frequent monitoring
To initiate the required conditions, system flooding allows the microbes to incubate. This flooding wets all the material in the treatment unit, and allows soluble carbon and sulfate to come into contact with the microbes thereby allowing establishment of attached microbial growth without washing food and microbes out of the reactor unit. During this flooded period microbes use oxygen in the influent water to consume organic carbon. These microbes may continue to be present in the system during normal operations and many aerobic microorganisms are facultative instead of obligate aerobic microorganisms.
Generally, flooding of the system is conducted by shutting off the effluent valves, allowing the influent water to fill the treatment units, and then bypassing any additional source water around the treatment unit for the duration of the flooded period. The second phase can include a recirculation period that is intended to circulate dissolved organic compounds and sulfate through the reactor to stimulate the growth of sulfate reducing microbes in all portions of the reactor. A two week flooded period followed by a four week recirculation period was successful for the start-up of the biochemical reactor used at the Standard Mine (Reisman et al. 2008). The second phase of start-up may instead include a recirculation period that mixes the biochemical reactor effluent with a small portion of untreated source water as influent to the treatment unit. During this type of recirculation phase, the majority of soluble organic compounds and dispersed microbes, that would otherwise be flushed out in a one-pass operation, are returned to the headA specific measurement of water pressure above a geodetic datum. It is usually measured as a water surface elevation expressed in units of length. of the reactor, while still providing a portion of fresh influent containing sulfate.
At sites where recirculation of water may be impractical (due to lack of power source for pumping), initially maintain very low flow rates of influent source water and allow the system to slowly adapt to increased flow and loadingMass of something per time entering a volume (volumetric loading rate) or flowing into an area (areal loading rate). over a several month time period. This practice is presumed to allow the biological system to establish attached populations that might otherwise be washed out of the system if high flows are used immediately. Slowly increasing the flows, and corresponding loading, allows the biological system time to accumulate and adapt to conditions that provide effective treatment. Generally greater success and shortened time for start-up will be achieved with warmer weather and water temperatures, therefore, starting operations in the summer months is preferable to the winter months in cold climates. (Riesman 2011, personal communication).
The success of flooding and recirculation or low flow, and determination if additional time is needed in these phases, is evaluated by monitoring certain water chemistry parameters in the influent and effluent water and in sampling ports within the biochemical reactor unit. The four key parameters are:
These parameters should be measured on a weekly or more frequent basis, if possible, in the influent to the reactor unit, the effluent of the reactor unit, and sampling ports within the reactor unit, if available. The difference between source water and reactor unit sulfate concentrations will indicate if sulfate reductionThe stripping of oxygen atoms from sulfate (SO₄²⁻), most often yielding sulfide (S²⁻) as an ultimate product. is occurring. Lower ORP values in the biochemical reactor unit will indicate if oxygen has been removed and conditions are suitable for sulfate reduction. An increase in pH from source water may indicate the commencement of sulfate reduction, which produces alkalinity, or it may be due to other inorganic alkalinity sources provided in the reactor, but either way, a pH of 5 or greater (toward neutral) generally promotes more rapid growth and activity of sulfate reducers. Additionally, field assays for sulfide performed by an experienced field technician can be used to supplement or replace sulfate measurements to determine if sulfate reduction is occurring in the reactor.
Once sulfate reduction is occurring in the reactor as evidenced by the key water chemistry parameters, the system can be gradually brought online to receive full flow by incrementally rerouting the previously bypassed source water flow to the reactor, or where recirculation is used, by gradually increasing the ratio of source water to recirculation flow to eventually eliminate the recirculation. The initial full flow operation is the third phase of start-up operations. During this third phase frequent sampling of flow rate and chemistry of the influent, effluent and internal reactor sampling ports, if available, are recommended in order to understand and document the performance of the system including sulfate removal rates, metal removal efficiency, ORP, and pH conditions. The specific water chemistry parameters are discussed further in Section 6.3. Generally weekly sampling during this period is suggested if feasible. The full flow phase of start-up is an appropriate time for a tracer test of the system. A tracer test is not required, but establishes an observed residence time distribution at start-up for later comparison if short-circuiting or blockage is believed to be developing.
The effluent initially released by a BCR once full flow is established is likely to be high in suspended solids, biological oxygen demand (BOD), and nutrients. The cause of these high values is believed to be the flushing of fine solids and dissolved compounds from the substrate. The initially high values have been observed to decline rapidly to acceptable levels, generally requiring a few weeks of operation. Presumably this correlates to the flushing out of the soluble materials.
In addition to monitoring the biochemical reactor effluent during the third phase of start-up, it is also important to monitor and evaluate the effluent of all system components including the pre- and posttreatment units such as aerobic polishing units or settling ponds. The point of compliance for the entire treatment system should also be monitored at more frequent intervals during this third phase of start-up.
As a caution: it is possible to leave the biochemical reactor in the flooded period too long. An extended period of flooding may generate a buildup of metabolic byproducts, including high levels of sulfide that have been found to be toxic to the bacteria (Luo et al.2008). Generally, the conditions can be returned to promote the growth of sulfate reducers by providing fresh influent source water and allowing waste products to exit the system in the effluent.
6.2 Monitoring and Maintenance Activities
Biochemical reactor systems generally have a lower operation and maintenance requirements than traditional active treatment plants. However, a certain level of operations, monitoring, and maintenance is required. The level of effort required depends on many factors including chemical and hydraulic loading rates, variability of loading rates, design, location, and the degree of flexibility in the discharge criteria.
This section describes the operations and monitoring that should be considered for a biochemical reactor. The main objectives of operations and monitoring are to manage the system for smooth operation and minimal upsets and to determine compliance with target water quality criteria. To achieve smooth operation it is important to maintain flow and loading within the designed system limits and to regularly assess system conditions and performance as a predictor for potential upsets, necessary maintenance, decline in effectiveness over time, and end of useable life.
Three main types of monitoring to consider are as follows:
- monitoring the physical condition of the system
- operational performance monitoring of system flow rates and water chemistry conditions
- monitoring water chemistry for regulatory compliance
6.2.1 Monitoring the Physical Condition of the System
Monitoring the physical condition of the system generally includes visual inspection of the overall system and site and the various components of the system, including pre- and post- treatment units. Observe changes from normal operations and track changes that may occur slowly over time in order to identify and mitigate minor problems before they cause major system upsets. Regular inspection should include monitoring flow through the system, system integrity, and site access.
It is important to maintain flow through the biochemical reactor units and identify if preferential flow or clogging is causing areas to dry out or become stagnant. Either of these situations will impact treatment performance because of the loss of treatment area. The following should be included in monitoring system flow:
- Monitor hydraulic head with piezometers, gauges or standpipes or other designed feature at the influent and effluent to treatment units.
- Check operation of gravity feed, look for clogging and water back up.
- Inspect drop inlet/outlets and weirs, look for clogging and water back up.
- Ensure pumping systems, if used, are operational and that required pump maintenance is performed as required by manufacturer.
- Check for clogged piping, short-circuiting, and channelization. These issues may or may not be evident with simple visual inspection. Systems may be designed with features for back flushing or changing flow path, and these operations should be performed as suggested by the system designer but may be on the order of once to twice a year.
- Check flow through pre- and posttreatment components to the system.
Maintaining system integrity can help to ensure an operational system. Monitoring for system integrity should be performed as a walk through with visual inspection of the following features:
- Inspect dikes, berms and other containment or erosion control features for physical damage from stormwater events or animal disturbance.
- Inspect any substrate feed equipment including pumps and power sources.
- Inspect usability of any sample ports and automated instrumentation.
- Inspect for animal activity in and around treatment units including the presence of water loving or burrowing animals (such as beaver and muskrat). Insects and poisonous snakes may be problematic from a health and safety perspective.
- Monitor for hydrogen sulfide is important for health and safety, generally levels at an open air facility will not reach toxic concentrations but low lying areas or manholes could accumulate this toxic gas.
- Monitor for odors especially in areas that have nearby residents, since even a small amount of hydrogen sulfide odor may be unacceptable to neighbors.
- Inspect that vegetation occurs in and around biochemical reactor and treatment system only in areas designed to support vegetation:
- In some cases vegetation may cause problems with flow paths and system chemistry, in other cases negligible impacts have been observed.
- Some posttreatment processes may rely on vegetation for functional processes.
- Excessive vegetation external to the bioreactor may impede access or tree roots may compromise subsurface liners or berms.
- Invasive species can also become a maintenance issue depending on the land management practices in the area.
Maintaining and controlling site access is key to keeping systems operating smoothly by facilitating the ability to access the site when problems arise, as well as limiting potential problems caused by unauthorized persons. Monitoring site access should include the following:
- Inspect access road conditions.
- Inspect access restriction structures such as fences and locked gates.
- Post emergency numbers at the site so anyone witnessing an unusual condition (for instance, a berm break or leak, higher than normal odor, flooding, or vandalism) can contact site personnel.
The frequency of physical condition monitoring inspections largely depends on site accessibility but is suggested at once a month when feasible. If influent loading conditions or other site conditions vary, more frequent monitoring may be required.
6.2.2 Operational Performance Monitoring of Flow and Water Chemistry
Both influent and effluent flow rates and water chemistry monitoring are important to assess the operation of the biochemical reactor unit. Frequency, location, and water chemistry parameters suggested for monitoring are discussed in the following subsections. Table 6-1, Sample Locations, Frequency and Purpose of Sampling, summarizes the sampling locations, frequency and purpose of sampling.
6.2.2.1 Sampling Frequency
A monthly operational monitoring frequency has been established for several demonstration sites (Bless, et al. 2008). In some cases, monitoring is increased to once per week for field parameters and once per two weeks for laboratory analytical parameters in the summer months when remote sites are more accessible (see Appendix B.8 Leviathan Mine Case Study). Always be cautious about sample frequency through changing seasonal conditions and the effect these seasonal changes can have on a sample or on a site's accessibility for collecting samples.
6.2.2.2 Water Chemistry and Quality Parameters
Water chemistry parameters generally consist of those that can be measured in the field with probes, meters or colorimetric tests kits and those that require laboratory analysis.
Field parameters, their importance and their general purpose are listed below under required and optional categories. Required field parameters include the following:
- Flow rate – used to track system loading, monitors if treatment flow differs from designed treatment flow, recording of any overflow or treatment by pass events
- Temperature – tracks changes in the system, very cold temperature can cause low microbial activity or poor settling of solids
- pH – tracks if pH is changing through the reactor units and is within the designed target range, usually between 5 and 8.5 but variations in design pH exist
- Oxidation reduction potential (ORP) – tracks changes in how oxidizing or reducing the water conditions are through the biochemical reactor unit. Low ORP indicates reducing conditionsA system in which the gain of electrons is energetically favored due to a low reduction potential. suitable for sulfate reduction. Microbes that use oxygen and other higher energy electron acceptors (i.e. nitrate) generate the low ORP conditions suitable for sulfate reduction. High ORP inside the BCR substrate or BCR effluent can indicate that microbial activity is limited, higher levels of oxygen are entering the system than anticipated, or short circuiting is occurring.
- Alkalinity – can be measured in the field or in the laboratory, tracks changes through the system and reactor units that are due either to alkalinity production from sulfate reduction or alkalinity addition from chemical or physical substrate
- Visual observation of effluent color – black precipitate in the biochemical reactor effluent water indicates the presence of metal sulfides and therefore is a good indicator that sulfate reduction is occurring. White precipitate, which is often elemental sulfur, is frequently observed and also indicates that sulfate reduction is occurring. Generally, in a well-functioning system the black color will be dominant in the effluent, while the white precipitate may be evident surrounding the outfall area.
Optional field parameters are those that provide supplemental information on the system or can be used as a substitute for a required field parameter:
- Dissolved Oxygen (DO) – indicates the level of oxygen in the system, oxygen-depleted conditions (below 2 mg/L as measured by probes) in the BCR are required for successful sulfate reduction. High DOdissolved oxygen within the BCR or BCR effluent can indicate that microbial activity is limited, higher levels of oxygen are entering the system than anticipated, or short circuiting is occurring.
- Iron and iron speciation – can be measured with a field test kit. Iron speciation identifies whether reducedIn chemistry, having gained electrons. Often gaining electrons is accompanied with gaining protons (hydrogen). As an example, when O₂ reacts with H₂, the oxygen is reduced, forming H₂O. (Fe2+) or oxidized (Fe3+) iron predominates in the system. Reduced iron is indicative of a well-functioning system. Iron concentration indicates whether iron loading (load = concentration times flow rate) is above load design. Also in some cases iron concentration in the effluent has been used as an indicator for compliance with other metals concentrations (see Appendix B.8 Leviathan Mine Case Study);
- Acidity – can be measured in the field or in a laboratory, generally tracks the opposite of alkalinity and provides similar information;
- Electrochemical potential (EhThe redox potential is the tendency of a compound to gain an electron. This is most often measured as the voltage required to prevent electrons to transfer between the measured sample and a standard reference electrode. For Eh, that standard reference, defined as zero volts, is H2 → 2 H+ + 2 e- at a specified standard condition.) – is an ORP measurement adjusted to standard hydrogen potential rather than some other reference electrode; and
- Specific Conductivity – often measured to monitor for significant changes, however, this parameter is generally not considered critical.
Laboratory parameters, their importance and their general purpose are listed below under required and optional categories. Some of the following can be measured in the field using appropriate test kits.
- Metals of concern – can include aluminum, arsenic, cadmium, copper, chromium, lead, iron, manganese, selenium, and zinc or other metals that may be present and regulated at the site. Metals are measured in the influent and effluent to determine removal efficiencies and to determine regulatory compliance with state and/or federal water quality criteria. High levels of iron and aluminum can increase clogging potential and are often monitored closely. Often only dissolved metals are measured unless total metals are regulated at the site.
- Sulfate – tracks the rate and level of sulfate reduction in the biochemical reactor. Can be an indicator of healthy sulfate reducers and can be used to determine if enough sulfide, stoichiometrically, is produced to precipitate the load of metals in the influent source water.
- Alkalinity – can be measured in the field or in the laboratory, tracks changes through the system and reactor units that are due either to alkalinity production from sulfate reduction or alkalinity addition from chemical or physical substrate
- Biological oxygen demand (BOD) – used as an indicator of the concentration of readily available organic carbon in the system water. This parameter is used to ensure sufficient food source and may also be regulated in the system effluent to protect receiving water bodies.
- Chemical oxygen demand (COD) – tracks the oxygen demand from chemical oxidants. CODchemical oxygen demand may also be regulated in the system effluent to protect receiving water bodies.
- Total dissolved solids (TDS) – may be regulated to protect receiving water body. TDS is not treated for in biochemical reactors but some removal may occur.
- Total suspended solids (TSS) - may be regulated to protect receiving water body. TSStotal suspended solids is not treated for in biochemical reactors but some removal may occur.
- Monitoring of substrate use - If appropriate sampling access points are installed during construction, pre-placed packets or cores of the substrate can be accessed to determine how much solid substrate remains in the system. Typically sampling for substrate use is done after five to ten year of BCR operation. Cores or packets can be observed visually for assessment of remaining key components of the BCR substrate (hay/straw, wood chips or limestone) with depth. Laboratory assessment can also be done by calculating loss on ignition and comparing that to measurements from the original substrate. Lime can be separated from organic matterStrictly defined, compounds in which carbon is bonded to hydrogen. Generally describes decomposed biological residues and other organic compounds synthesized by organisms. by careful washing or utilizing gold pan separation techniques and then dried and weighed and compared with a similar volume of the original substrate.
6.2.2.3 Sampling Locations
The following locations are recommended for operational monitoring: (see Table 6-1)
- source water influent to the entire treatment system
- Influent to the biochemical reactor unit, if pretreatment of source water occurs
- Internal biochemical reactor unit sampling locations, if applicable
- Effluent from the biochemical reactor unit
- Effluent from pre- and posttreatment components, includes final system effluent
- Point of compliance (discussed in Section 6.2.3)
In systems with redundant biochemical reactors or other redundant treatment units, the sampling locations described above should also be included for the redundant units.
|
Sample Location |
Parameters |
Frequency |
Purpose |
|---|---|---|---|
|
Source water influent to the entire treatment system
|
Laboratory Analysis: Metals of concern, pH, sulfate, Alkalinity, (TDStotal dissolved solids, TSStotal suspended solids if regulated) |
Monthly, possibly higher frequency |
Baseline influent for determining and maintaining operational system performance and may be required for regulatory compliance as comparison with treated water quality (% reduction) |
|
Required Field parameters |
Monthly, every two weeks if accessible and high variability of influent |
Operational monitoring for determining system performance |
|
|
Influent to the biochemical reactor unit (if pretreatment present) |
Laboratory Analysis: Metals of concern, pH, sulfate, Alkalinity |
Weekly to Monthly during start-up then this can be phased out once system is operating as anticipated. May be used for trouble shooting |
Operational monitoring for determining system performance |
|
Required Field parameters |
Monthly, every two weeks if accessible and high variability of influent |
Operational monitoring for determining system performance |
|
|
Internal biochemical reactor unit sampling locations, if applicable |
Required Field parameters |
Weekly to Monthly during start-up then this can be phased out once system is operating as anticipated. May be used for trouble shooting. |
Operational monitoring for determining system performance |
|
Effluent from the biochemical reactor unit |
Laboratory Analysis: Metals of concern,(Kirby and Cravotta (2005), net acidity / alkalinity, sulfate, CODchemical oxygen demand or BODbiological oxygen demand |
Weekly to Monthly during start-up then this can be phased out once system is operating as anticipated. May be used for trouble shooting |
Operational monitoring for determining system performance |
|
Required Field parameters |
Monthly, every two weeks if accessible and high variability of influent |
Operational monitoring for determining system performance |
|
|
Effluent from pre- and posttreatment components, if not already captured, includes final system effluent |
Laboratory Analysis: Metals of concern, net acidity/alkalinity, sulfate |
Weekly to Monthly during start-up then this can be phased out once system is operating as anticipated. May be used for trouble shooting |
Operational monitoring for determining system performance |
|
Required Field parameters |
Monthly, every two weeks if accessible and high variability of influent |
Operational monitoring for determining system performance |
6.2.3 Compliance Monitoring
How treatment discharge is regulated can vary widely depending on the regulatory agency, geographical location, and receiving water body, as well as if the site is an abandoned or active mine site. Generally it is assumed that biochemical reactor systems will discharge effluent to surface water rather than groundwater. Surface water discharges to streams, wetlands and oceans are typically regulated by the Clean Water Act of 1972 (CWA) or State or tribe equivalent. In most cases active mine sites must comply with provisions of the Surface Mining Control and Reclamation Act (SMCRA) for coal mining and hard rock mining and secure permits for discharges to surface waters under the National Pollutant Discharge Elimination System (NPDES). Allowable contaminant concentrations regulated by NPDES permits are determined by the US Environmental Protection Agency’s technology-based standards or toxicity-based standards established for stream uses, or the state or tribal equivalent. The permits are generally site-specific and may include total maximum daily loads (TMDL). Abandoned mine sites fall under other regulatory purviews including CERCLAComprehensive Environmental Response, Compensation and Liability Act, RCRAResource Conservation and Recovery Act, SMCRASurface Mining Control and Reclamation Act, brownfields, state, local, or tribal programs.
Flexibility in the location of the point of compliance has benefits. It may be best to locate this point at the point of discharge or perhaps below an acceptable mixing zone. All locations of the point of compliance should include protection of ecological receptors in the stream (for instance, anadromous or short freshwater reach to a marine outlet). Regulatory flexibility depends on the purpose of a treatment system, including whether the system is intended as an interim water treatment measure, as the long-term treatment solution, or whether the system is intended to provide just some level of treatment in an abandoned remote location that is otherwise impractical to employ more active water treatment systems (see ITRC MW-1 2010 Regulatory Issues https://projects.itrcweb.org/miningwaste-guidance/reg_issues.htm). Often when BCRs are used as an interim water treatment measure while a longer-term plan is being formulated, certain water quality parameters may be waived that would otherwise be applied to treatment plant discharges. Often only pH and metals are targeted for regulatory compliance in these interim or very remote situations (see Appendix B.8, Leviathan Mine Case Study). Depending on the setting and goals of the system it may be possible to target percent contaminant removal for the system. However, when a bioreactor system is planned as the long-term solution in an accessible area, water quality parameters targeted by the regulator may be more comprehensive and may strive to meet tribal, state, or local water quality criteria or maximum contaminant levels (MCLs). A more detailed discussion on these issues is presented in Section 7.
It is important to determine what the regulatory point of compliance will be during the design of the system, as mentioned in Section 4. The entire treatment system that includes the biochemical reactor must be considered in determining the point of compliance (POC). The system may include naturally occurring areas that allow aeration and/or settling and if these areas are included as a functional portion of the system, they should be considered in POCpoint of compliance selection. In some locations it may be unacceptable to use a natural area (i.e. natural wetland) as a functional component of the system. This must be determined in the design phase as it will impact where the POC must be and the design of the system to achieve compliance at that POC.
Frequency of compliance monitoring also can vary based on location, goals of treatment, and variability of influent flows or concentrations. The intended purpose of the system and the location of the system often dictate the required monitoring frequency. Remote mountainous locations may only allow infrequent site visits, particularly in snowy climates. It is anticipated that these sites also have more flexibility in the discharge water quality criteria as site visits may be practically limited to once a month or less due to accessibility (see Appendix B.8 Leviathan Mine Case Study). Other sites that are implemented in accessible areas that discharge into sensitive water bodies can require more frequent compliance monitoring. The monitoring frequency should be agreed upon with the regulator in advance of system implementation and should be compatible with the goals of the system. If the goals of the system are to solely reduce contaminant loads in a remote location, then compliance monitoring frequency can be on the order of once a month or less. In contrast, a system that is expected to protect a critical water body should have a more frequent compliance monitoring frequency, once per week or once per two weeks depending on influent variability and anticipated system performance. Often if water quality criteria are based on 30 day average concentrations, a once per month compliance sampling event has been considered sufficient to determine compliance, particularly at remote or limited access sites (see Appendix B.8 Leviathan Mine Case Study). Most importantly since these systems are often used in remote areas, a realistic compliance monitoring frequency should be established.
In some cases monitoring the influent is required, along with POCpoint of compliance monitoring. Sampling the influent is also beneficial for determining percent removal for metals and sulfate. Water chemistry parameters for compliance monitoring generally always include pH and the dissolved fraction metals of concern. If selenium is a metal of concern, often the total recoverable concentration, rather than just the dissolved fraction, is regulated due to its mobility and ecotoxicity as a solid. The compliance monitoring parameters may differ from the operational performance monitoring parameters discussed in Section 6.2.2. Typically ORP, electrochemical potential, acidity, and alkalinity are not regulated, although these parameters are important indicators of the status of the biochemical reactor. Effluent levels of sulfate, BODbiological oxygen demand, CODchemical oxygen demand, temperature, and total dissolved solids (TDS) and total suspended solids (TSS) have been regulated for certain systems even though some of these parameters are not targeted for removal by the biochemical reactor. Again, regulated water chemistry parameters are dependent on the regulatory agency, the receiving water body, and the agreed upon goals of the system. For example Michigan has narrative water quality standards for TSS (Rule 50 of the Michigan Water Quality Standards (Part 4 of Act 45) (http://www.michigan.gov/documents/deq/wb-npdes-TotalSuspendedSolids_247238_7.pdf).
6.3 Maintenance
6.3.1 Substrate Nutrient Change Out
The life cycle of the BCR is dependent largely on loading of metals and electron acceptors and can vary greatly site to site. The following steps can be taken to assist in predicting when the solid organic substrate needs to be replaced or refreshed. The viability of the organic substrate can be monitored via the ORP front, which is the location in the bioreactor where conditions switch from oxidizing to reducing (reducing is desired). To determine the position of the ORP front, the bioreactor should be sampled horizontally and/or vertically and the samples should be analyzed for metals, organic material and limestone. Several methods exist to determine this ORP front’s location. If samplers of various depth (Figure 4-2) were designed into the BCR, these may be used with an ORP probe. A perhaps more reliable way to sample the vertical profile is to use ferrous sulfide gel (or ferrous oxide gel) inserted into a slotted pipe (similar to the sampler shown in Figure 4-2, but having perforations or slots along the whole length). The pipe, or a few such pipes, can in turn be inserted into the bioreactor, and left for 24-72 hours. The point at which Fe+2 turns to Fe+3 is the location of the ORP front.
To estimate the time frame for substrate change-out, the substrate should be sampled at 6 months and at 1 year after steady-state operation has commenced. The rate of progression of the ORP front can then be estimated. It is recommended that the bioreactor be resampled at the estimated half-life of the substrate to evaluate the reaction progress, then again near the time that change-out has been estimated to be needed.
The design of the BCR system may include liquid feed or solid substrate and may include pre- or post-treatment units where precipitated metals and excess biomass collects. All of these treatment units will require sludgeA watery semi-solid. or substrate removal at some point in the life of the system. Sludge removal efforts can be significant and need to be incorporated into the maintenance and funding plan. Sludge and substrate removal considerations include protecting treatment unit liners and piping, access and space for pumps or manual excavation equipment and dewatering equipment as well as transportation of solids to an appropriate off-site or on-site disposal facility. An example of sludge removal and dewatering from a liquid fed system is included in the Leviathan Mine Case Study (B.8). Sludge removal from collection ponds is not likely to be conducted frequently and therefore the periodic nature of this maintenance activity can be a challenge to managing funding cycles.
The waste substrate should be tested for toxicity to determine the appropriate disposal option. The Toxicity Characteristic Leaching Procedure (TCLP) test for hazardous characteristic (soluble metals) should be included as one of the tests. Additional testing would depend on state and local regulatory requirements, for example the state of California requires additional testing procedures and additional constituents beyond the TCLP.
To address short term changes in acidity of the bioreactor that may adversely affect the microbiologic population, limestone amendments can be added. Similarly, the organic substrate life may be extended by dressing the top with fresh organic material. A garden tiller (Thomas and Romanek 2002) or possibly a low-pressure tracked vehicle with a tiller may be used to mix the fresh organic into the substrate bed.
6.3.2 Troubleshooting
Two main categories of troubleshooting exist: chemical trends and physical trends. Chemical trends involve: 1) increasing trends in the concentrations of Fe, Al, and Mn in the influent, 2) decrease of reduced sulfur/increase in sulfate in the effluent, 3) increase in BODbiological oxygen demand/CODchemical oxygen demand in the system effluent, and 4) change in Eh, pH in the reactor, and DOdissolved oxygen. Physical trends include plugging, loss of effluent, overflow of bioreactor or influent pond, short circuiting, and loss of structural integrity of berms, dikes, ponds, erosion, and storm water control features.
Triggers are system operational limits (usually parameters measured in the system effluent) which, if exceeded, identify the need to take corrective action (response) to return the system to optimal performance. Examples of triggers include changes in metals concentrations, BODbiological oxygen demand, alkalinity and sulfate. The specific selection and numerical limits for triggers are unique to each bioreactor system. Triggers may be decided upon during system start-up, and should be agreed to by all parties involved in the operation and regulatory oversight of the bioreactor system. Triggers make the process of identifying and resolving problems within the bioreactor system much more efficient.
The following sections describe the parameters that should be monitored to understand problems or the potential for problems in a bioreactor unit. Where possible, triggers and likely response to the identified problem are included.
6.3.2.1 Field Data
This section provides “real time” guidance on BCR or system observations that may suggest potential performance problems that would be validated when results from analytical sampling are received (see Section 6.3.2.2). Each system is unique; the following discussion is focused on systems that are past the commissioning/start-up period and would be considered in “steady state” operation.
Note: some of the guidance provided may not apply in every situation; alternative configurations (such as upflow or horizontal flow) may create circumstances that are unique to a given site or system. The guidance is typically applicable for downflow/top-fed configured BCRs unless otherwise noted.
Water levels are easy to measure using staff gauges, staining on the sides of channels or BCR standing water surfaces. For a top-fed BCR, for example, there should be very little difference in elevation between the standing water on the surface of the cellAn individual unit in a treatment system. and the water level in the discharge piping (see Figures 5.5 and 5.6). If there is, this might suggest blockage in the effluent piping, loss of permeability in the substrate, or other blockage-related conditions that might cause the water level above the substrate to rise. A BCR exhibiting a relatively large (greater than 25% of the substrate thickness) head loss through the substrate should trigger an investigation into why it is occurring.
Sometimes, there may be evidence of differential water levels that no longer exist. For example, staining or flotsam on the shoreline of a BCR could suggest that the standing water level could have been higher than a level currently being observed during an inspection. Inspectors should be vigilant for other observations that might provide clues to potential future problems.
If portions of the substrate are exposed above the typical standing water level in a BCR, the water levels within these exposed substrate zones should be compared with open water. A laser-leveling instrument might be required to do this, since minor differences can indicate a short-circuiting condition.
Most BCR treatment systems should have the ability for measuring flow rate. Unless a BCR is being closely monitored for evaporation losses, it is unlikely that flow data would be collected on the influent and effluent. Whether the flow rate is visually estimated from a staff gauge in association with a weir or flume or data is electronically collected on a data logger, any site inspection should include a secondary/validation flow measurement using “fool proof” flow measuring techniques such as bucket and stop watch or other simple methods. Differences in expected flows versus observed flows during an inspection may suggest a leaking BCR liner or the unseen effects of vandalism.
Close attention should be paid to stains and/or debris on staff gauges for clues of unusual flow events. For example, an old trick might be to “dust” a removable staff gauge/dipstick in the protected stilling well of a flume or weir. If the water level rises in the stilling well in response to a high flow event, the dust would be rinsed off to the high flow mark. While the inspector would not know the exact duration or time of the high flow event, this observation would be a clue to check the climate data or values on a data logger for more details. Any evidence of excess flow above the design value (within expected limits) should trigger a focused evaluation of the analytical data for lingering aftereffects.
Some BCR systems have built-in safeguards to prevent overloading in high flow situations. These design features might include compound weirs or overflow devices. For troubleshooting, include inspections of points in the piping system, including any emergency spillway in the crest of a BCR, for evidence of excess flow patterns. This evidence may include:
- ponded water downstream from a design overflow/bypass weir
- staining on pipes, tanks, and exposed geomembrane liners
- flotsam adhering to BCR “shoreline”
- unexpected high readings in flow depth data downloaded from data loggers
Overflow may be related to a number of abnormal operating conditions. Every BCR installation will have its own set of overflow related consequences. Thoroughly describe these consequences in any operation and maintenance manual that is developed for the system.
Despite the unpleasantness, the rotten-egg smell of a BCR that is reducing sulfate is a reliable indication that it is functioning well. Care should be taken in inspecting portions of the BCR where hydrogen sulfide (H₂S) gas could accumulate; i.e., the effluent piping and any subsurface structure where BCR effluent piping could vent.
Regardless, a faint presence of H₂S in the effluent is a sure sign that a BCR designed for sulfate reduction (as opposed to nitrate or selenium reduction) is probably working well and subsequent analytical data is unlikely to be disappointing.
Oxidation reduction potential readings are one of the easiest ways to evaluate the relative health of a BCR quantitatively. When troubleshooting a BCR, it is recommended that the ORP of the BCR effluent be measured first, when the inspector arrives on site. The reason for this is that the oxidizing conditions of very acidic MIW (or the standardizing solution) can “poison” the platinum electrode and cause it to produce readings that are not representative of true BCR effluent ORP. To demonstrate whether this effect can bias the ORP at a given site, inspectors/samplers should measure the ORP of the BCR effluent, then the influent and repeat the effluent measurement to see if the initial reading is replicated.
ORP readings of zero millivolts or below are reasonable indications that the BCR is functioning as designed. Readings above this threshold might suggest current or recent overloading.
If an ORP meter/electrode is not available, a DOdissolved oxygen reading in the BCR effluent may be a reasonable surrogate field observation. The BCR effluent should exhibit DOdissolved oxygen readings of 1 mg/L or less. For comparison, fully oxygenated water should have a DOdissolved oxygen of 8 mg/L or more. If the BCR effluent is too oxygenated based on this criteria, recent or current overloading or substrate organic matter depletion might be suspected.
BCR effluent pH should be circumneutral. If it is less than 6.0 standard units, recent or current overloading should be suspected. If the pH of the influent is greater than the effluent, fermentation bacteria (which typically cause pH decreases) may be too populous. The short term remedy for this situation might be to add limestone of some other form of buffering alkalinity to the upper foot of the substrate (top-fed cell). Revisiting the bench and pilot data upon which the substrate design was based may be needed to see if this phenomenon was previously observed.
BCR effluent conductivity should be similar to the influent values under steady state conditions. If the effluent conductivity is greater than the influent, this suggests that limestone in the substrate is being consumed. This might be observed during start-up but as the microbial community in the substrate matures, the reduction of sulfate and the concomitant production of alkalinity (see Section 1, Equation 11 and Appendix A.1.1) should reduce the rate of limestone dissolution and the influent and effluent conductivity values should approach a similar value. If the effluent conductivity is higher than the influent after a year’s operation, overloading should be suspected. Again, bench and pilot data might be revisited to assess whether observations during steady state operation have a precedent unique to the site/system.
Sulfate ion contributes to conductivity. If the effluent conductivity is significantly less than the influent, this may be the result of significant biological activity, especially during warmer weather when the influent MIW temperature might be relatively elevated.
A white precipitate on rocks or plants near the BCR effluent is another indicator that a BCR may still be reducing sulfate to sulfide. This material may be native sulfur; another bacterial community will probably be present to oxidize it back to sulfate. This should be verified through laboratory analysis. The precipitate may be a variety of other mineral that indicate the BCR may not be working as expected. This micro-ecological relationship is one of the reasons that H₂S odors in the BCR effluent are not overpowering. The absence of this precipitate may be due to a relatively low sulfate concentration in the influent MIW or a well-matched rate of metal loading and sulfate reduction bio-kineticsThe study of rates of reaction.. However, there is typically excess sulfate present in MIW and excess sulfide in the BCR effluent as well. Figure 6-1 illustrates typical visual evidence.
Figure 6-1. Biosolids cloudiness visual evidence of BODbiological oxygen demand at the Peerless Jenny King BCR in Montana, August 2007.
Source: D. Reisman
BCR effluent may be clear immediately after sample collection in steady-state conditions. However, if the sample is allowed to stand for a few minutes, it should become cloudy with suspended biosolids as the sample equilibrates with the oxygen in the air. This visual observation is a surrogate test for biological oxygen demand. The cloudiness indicates acceptable BCR operation as the bacterial community degrades the organic fraction of the substrate. During start-up, these suspended biosolids may clog sampling filters, so the samplers should be prepared with high capacity filters or be satisfied submitting unfiltered samples for laboratory analysis. In short, the presence of cloudiness in the BCR effluent that is allowed to stand is an indication that the unit is functioning well.
An abnormal weather event at a BCR site should trigger a site inspection just to confirm that the BCR unit survived. High spring runoff flow falls into this category. For remote sites, it may be difficult to know when a major weather event occurs. From a troubleshooting perspective, if an abnormal weather event is suspected, inspectors should be vigilant for evidence that the BCR only sustained direct precipitation that fell on it and did not capture runoff from other parts of the site.
For example, a Forest Service road traverses the mountainside above the Peerless Jenny King BCR site in Montana (see Appendix B.10 Peerless Jenny King Site Case Study). An inspection the spring that followed construction revealed a fresh deposit of alluvial sand and debris in one corner of the upper wetland zone which was intended to polish iron up-gradient of four BCR cells. Expanding the inspection to the adjacent areas revealed an abandoned cabin filled with sand up to the windows. Eventually, the source of the sand and debris was traced to the Forest Service road where a roadside berm had been breached, probably in the seasons prior to the BCR construction. The abandoned cabin functioned (at least temporarily) as a sedimentationThe process of depositing entrained particles from water. basin.
Troubleshooters should be prepared with rudimentary hand tools to manually correct issues such as the one described above and/or fix damage that could affect system performance.
Many MIWs contain dissolved and suspended iron and this situation is one of the largest nuisances for influent piping to BCRs as well as other water treatment systems. Iron oxy-hydroxide scaling can affect the accuracy of flow measuring devices (e.g. weirs and flumes) and/or restrict flow to the extent that the BCR only receives a fraction of the source MIW or it is completely by-passed (see Appendix B.14 Lady Leith Mine Case Study). While MIW delivery pipeline scaling will be a continuous maintenance headache, a few trouble-shooting tips that may be helpful (assuming that pipeline maintenance was included in the system design) follow.
Collect and analyze MIW close to or at the source and (especially if a long delivery pipeline is included in the design) and do the same near the BCR inlet structure. Comparing the iron concentrations over time should suggest that iron scaling is accumulating in the pipelines. If the MIW is not well buffered, one might even detect pH decreases as the dissolved iron hydrolyzes and hydrogen ions are produced.
Most designers know that iron scaling occurs more frequently at valves, fittings, flow restrictions, changes inflow regime (progressing from open channel flow in a pipe to full pipe flow in a “dip” in the pipeline profile), and drainage collection galleries.
One temporary and inexpensive scaling remedy that may buy some time (until a pipeline cleaning unit can be mobilized) is adding massive doses of sugar to the source MIW before it enters the scaled zone in the pipe conveyance (Gusek 2012). As the TOC in the sugar reduces the ORP of the MIW, the ferric iron in the iron oxy-hydroxide scale is reduced to more soluble ferrous iron and the scale dissolves. This technique was successfully used at a BCR site in Arizona.
Caution: while this sugar remedy may temporarily fix the physical scaling problem, the dissolution of iron oxy-hydroxide is likely to mobilize other MIW chemical parameters that may be adsorbed to the scale such as arsenic (if it were originally present in the MIW even in trace amounts) and spikes in these parameters should be expected in the BCR influent. It is recommended that scale samples be analyzed prior to implementing this remedy to ascertain what might be expected.
Long-term settling of substrate as it degrades has yet to be documented. When vegetation establishes on BCR surfaces (whether by design or on a volunteer basis) and the roots and detritus from the plants accumulates, the steady addition of organic matter can mask settlement. Wildeman, et al. (1993) cited “…that biomass accumulation rates in tropical primeval coal swamps approached one foot every 10 years (Bateman 1950).”
Short term “settling” of substrate was observed during the construction of the Fran Mine pilot scale BCR in Clinton County, PA (see Appendix B.5 Fran Coal Mine Case Study). In this instance, the surcharge load of a soil cover being placed on the substrate induced compaction, which is not the same effect as settling. As the construction contractor noted the apparent settlement, additional soil was placed to remedy the situation which caused even more compaction. The final cover lacked a crown and in fact exhibited an obvious depression in the center of the cell. This effect should be anticipated in design of BCR covers; and compaction effects on BCR substrate (whose mixture proportions could vary due to field changes) should be verified in the field prior to cover material (i.e., soil) placement.
6.3.2.2 Chemical Trends
High concentrations of iron in the influent water may form ferric oxyhydroxides that may clog the pore spaces in the bioreactor (Section 4.2.1.1 and Appendix A.1.2). To avoid formation of ferric oxyhydroxides, keep iron levels in the influent below 100 mg/L at pH above 4.0. If the influent water is reducing, the iron concentrations could be higher, because the iron will remain dissolved under these conditions.
Aluminum can cause problems in some passive treatment systems by forming minerals that can cause plugging of the void spaces within the limestone in the system (Section 4.2.1.2 and Appendix A.1.3). In limestone-dominated passive treatment systems, the mineral gibbsite [Al (OH₃)], a gelatinous solid, may form. However, in BCRs, gibbsite does not appear to form and the unidentified aluminum-containing minerals that do form are less prone to cause plugging (Gusek and Wildeman 2002b). This was confirmed by Thomas and Romanek 2002, who identified non-gelatinous aluminum hydroxy-sulfate precipitates that formed instead of gibbsite in their limestone buffered organic substrate (LBOS)A solid media containing limestone. Term is often used to describe the substrate used in vertical flow ponds.-filled BCR test columns.
Manganese removal is generally poor in bioreactors (see Section 1.5.3, Equations 9 and 10, and Appendix A.1.4); however, reducing conditions typically found in bioreactors may release manganese bound in substrate at start-up. This situation is usually temporary until mobile manganese compounds have been depleted. If data show that manganese is being removed in a mature bioreactor, this may be a sign of overload, with manganese likely replacing calcium in the limestone, creating the mineral rhodochrosite (MnCO₃) (Gusek and Schueck 2004).
Under normal operating conditions in a bioreactor, sulfate ions are reduced to sulfide (see Section 1.3.3.4, Section 2.4, and Appendix A.2.1) by microorganisms and the sulfide reacts with dissolved metal cations to produce insoluble sulfides. Thus, one would expect to see lower sulfate concentrations in the effluent than in the influent. Monitoring sulfate concentration in the effluent therefore provides a measure of the bioreactor performance. If sulfate concentrations in the effluent increase with time, this likely indicates decreased metabolic activity of the microorganisms and decreased bioreactor performance.
BODbiological oxygen demand and chemical oxygen demand (COD) are measures of the amount of oxygen potentially required to oxidize by organic chemicals present in the water. BODbiological oxygen demand measures the oxygen demand of biodegradable organic chemicals, whereas CODchemical oxygen demand measures the oxygen demand of both biodegradable and nonbiodegradable organic chemicals. In a mature bioreactor, the effluent will ordinarily contain a steady state level of BODbiological oxygen demand. In the inlet piping and bioreactor cell, BODbiological oxygen demand should be totally dissolved. However, once the BODbiological oxygen demand-containing effluent contacts air, biological processes may cause the formation of suspended solids, which can cause pipe scaling. Effluent piping may need to be cleaned periodically to remove scale. The scale should be characterized to determine whether or not metals are present in BODbiological oxygen demand solids. If metals are present, effluent may be redirected back through the BCR.
Alkalinity typically increases during operation of a bioreactor and approaches a steady-state level (see Section 1.3.3 and Appendix A.1.1 ). The increase is due to dissolution of limestone or as a byproduct of sulfate reducing bacteria. The increase in alkalinity buffers the acidic influent and helps to maintain the minimum pH of 4 - 6 needed for the sulfate-reducing bacteria to function. Sometimes the conditions within the bioreactor are sufficient for maintaining the optimum pH, but for extremely acidic influent streams the pH would need to be adjusted prior to entering the bioreactor (Gusek and Schueck 2004).
The presence of nitrate in the BCR influent can interfere with sulfate reduction as nitrate must be reduced before sulfate. If sulfate removal rates decrease or are poor for no other obvious reason, testing for nitrate may be warranted. This parameter could be inadvertently affected by seemingly unrelated site activity such as fertilizer application associated with revegetation work. If nitrate is already present in the BCR influent, it should decrease in concert with sulfate.
The presence of mercury in the BCR influent should raise health and safety issue flags, as methyl mercury, which might form due to the activity of sulfate reducing bacteria in some circumstances, is extremely toxic. Methyl mercury can be adsorbed through the skin. If mercury is suspected in the MIW, a mercury speciation laboratory study using the proposed substrate should be mandatory. If excessive methylation is confirmed, the BCR technology may not be appropriate. It is suspected that mercury should preferentially form insoluble HgS in a BCR; mercury speciation testing in a full scale BCR is strongly recommended.
The presence of radionuclides (for example, uranium 238, uranium 234, thorium 230, radium 226 and others, Hofmann et al. 2000) in the BCR influent may trigger special handling of the BCR substrate during periodic retrofits that involve substrate replacement. The expected sequestration and accumulation of radionuclides in the substrate under reducing geochemical conditions may require a license and may trigger air emission (radon daughter) management. See the Nuclear Regulatory Commission website for more information.
Typical BCR substrates will contain limestone (CaCO₃), which may contain small amounts of dolomite (CaMg(CO₃)₂. The ratio of these two parameters in the BCR effluent compared to the influent should provide data that allows estimating the rate of limestone dissolution. The ratio of calcium and magnesium of the limestone used in the BCR substrate is required for this exercise; this information is typically provided by limestone suppliers/vendors.
In one instance, the removal of magnesium in a BCR has been cited (Gusek 2000):
Four bench-scale test cells were constructed at the Smolnik mine and operated for two months to provide baseline information to design a larger pilot scale treatment cell. Two of the 200 liter-sized cells treated up to 5 liters of ARD per day. Results showed the viability of sulfate-reducing bacteria and limestone dissolution/exchange to yield metal loading reductions up to 98 percent of the influent values and pH increases to about 5.7. Remarkably, magnesium was removed in all four of the test cells, probably resulting from the formation of iron/magnesium carbonate in reducing redox conditions.
Magnesium removal should be viewed with suspicion and may be indicative of marginal BCR overloading.
6.3.2.3 Physical trends
Plugging occurs when the flow in the bioreactor is blocked due to buildup of solids within the pore spaces. Examples of plugging include blockage of pore spaces in the substrate by iron and aluminum-bearing precipitates, and blocking of pore spaces in the organic substrate by metal precipitates. Plugging can be mitigated by controlling iron and aluminum loading in the bioreactor influent (this would be verified in bench and pilot testing), and adding rocks to the organic substrate to create larger pore spaces.
Note that Thomas and Romanek (2002) observed on a microscopic basis that aluminum hydroxy-sulfate and metal sulfide precipitates typically filled the individual cells within the cellulosic framework of wood particles in BCR substrate. Filling of pore spaces between the substrate particles with aluminous precipitates might occur in overloading situations which can be mitigated through design changes, if required. See below.
The biological population within a bioreactor may be resilient to small, short-lived changes, but may suffer a significant decrease in performance if exposed to significant increases in metals concentrations or a decrease in pH, which can occur if the flow rate into the bioreactor exceeds design limits. This is referred to as overloading the bioreactor cell (see Section 4.4.2.4: Overflow Structures and Loading Control). Therefore, it is important to maintain flow through the bioreactor within design limits. Flow control in the full-scale system design can be achieved by several methods, including those in Gusek 2002b and 2004 and those described in Section 4.4.2.4:
- properly sized holding/mixing ponds
- flow-sensitive diversion ditches that are engaged only in overloading conditions (see Section 4.4.3)
- underground mine workings that are configured as storage reservoirs
Additional methods to maintain adequate flow through the bioreactor include exercising flow control valves (quickly open and close at least three times to flush out any iron scale in valve seat zone in the valve), and periodic cleaning of iron hydroxide scale deposits from the piping system.
Bioreactors are typically designed as vertical flow systems with the influent flowing downward (or upward) through an organic substrate. The effluent is collected at the bottom (or top) of the cell. When designing and constructing the bioreactor, it is important to avoid creating preferential flow paths (Section 4.4.5) whereby the influent can short circuit and avoid passing through the reactive zone of the bioreactor. Short circuiting is more likely near edges due to variation in hydraulic conductivity and has been repeatedly observed in lab-scale BCRs. In one case, 68% of the flow was found to be short-circuited through a lab-scale vertical BCR after slightly more than one year of operation (Fitch et al. 2008). In larger BCRs, such edge effects will be less likely to have a significant impact. During operation, evidence of short circuiting may include excessive total (unfiltered) metal sulfide concentrations with co-incidental low dissolved (filtered) metal concentrations. Carefully designed tracer testing by professionals may be required to identify short circuit pathways or zones in the BCR substrate.
The best method to determine short-circuiting is to perform a tracer test. A conservative tracer such as sodium bromide is mixed into the influent as a pulse or step-change and the effluent concentration is compared to the influent over time. The resulting curve shows the time distribution for the tracer, and thus fluid element carrying the tracer. Assuming some flow model such as a pair of parallel plug-flow systems, this residence time distribution (RTD) curve may be de-convoluted to find the apparent short-circuiting behavior.
Gas Lock-up
The West Fork Mine Case Study includes an example of gas lock-up. The sulfide gas lock problem was investigated in December 1996 by installing vent wells in the substrate and measuring the gas pressures. Observations indicated that the gas was a factor in apparent short-circuiting of the water passing through the cell. The layered geotextiles (geonet and geofabric), originally intended to promote horizontal flow, appeared to be trapping the sulfide gas beneath them and restricting vertical flow. The permeability of the substrate itself was for the most part unaffected. However, construction practices in the south BCR cell could have contributed to the situation. Here, a low ground-bearing bulldozer was used to place substrate in nominal 6-inch (15-cm) lifts. This could have created a layering effect that may have trapped gas as well.
Gas lock up occurs when gases generated by biochemical and chemical reactions within the bioreactor collect within the piping and other locations within the cell. The gas buildup can cause a decrease in organic substrate permeability and short circuiting. These gases include hydrogen sulfide from sulfide ion, and carbon dioxide from bicarbonate ion or dissolution of limestone. In small-scale bioreactors, such as bench or pilot scale cells, piping is typically made of rigid material such as PVC or high density polyethylene (HDPE). Gas lock up is generally not a problem in these small systems due to short pipe lengths and rigid piping materials. However, some larger-scale bioreactors have been constructed with flexible HDPEhigh density polyethylene pipe that can bulge upward and form gas traps. This can be a problem particularly in the gravel-filled drainage layer at the bottom of a bioreactor cell. Use of more rigid pipe and installation of gas vent pipes in the bioreactor cell are also methods to prevent gas lock-up. (Gusek 2004).
Maintaining the integrity of berms, dikes, ponds and other physical features of the bioreactor is critical to bioreactor function. Beavers and burrowing animals such as muskrats can cause significant damage to bioreactor structures. Muskrats are more likely to burrow in locations that are steeply sloped and vegetated, so keeping the slope to a 3:1 ratio and minimizing vegetative growth will reduce the likelihood of muskrat damage. Protecting the outside of the berm or dike with stone rip-rap (keep stone diameter to 6” or less to minimize holes where muskrats could enter) or covering surfaces at risk for muskrat entry with 1” wire mesh hardware cloth, heavy-duty plastic or fiberglass netting will also minimize the opportunity for muskrats to burrow into the bioreactor (Link 2005).
Beavers are attracted to the sound of running water and this triggers their digging and damming reflexes (Gusek 2004). To minimize the risk of beaver activity, the bioreactor cell can be designed with internal spillways or water level control structures that minimize the noise from falling water.
Flow of water into and within the bioreactor should be maintained within design limits to ensure optimal bioreactor performance. The performance of the bioreactor should be evaluated after major storms and corrective actions may need to be performed after major storms to restore bioreactor performance.
6.4 Sampling Protocol
Based on monitoring parameters described in Section 6.2, this section describes methods and equipment used to collect samples, and methods for in situ and laboratory analysis. Always check tribal, state, and federal rules for required or preferred sample collection and analytical methods.
6.4.1 Sample Collection
6.4.1.1 Instrumentation
A wide range of devices are available to collect field samples and obtain and process information (such as obtaining curves, trends). Generally, sampling probes are used, which extract defined water volumes. Probes may connect to a dedicated meter, which in turn can be connected to a computer for data collection and semi-instantaneous statistical analysis; some probes may instead be connected to computers through simple analog-to-digital cards.
Figure 6-2 shows an automatic sampler, which allows collection of water samples at a given frequency in three ways:
- Collection of grab samples. There are samplers with multiple compartments, where each container us used for one sample taken at defined periods of time The volume and frequency may be set, for example, 50 mL every 5 minutes, or 100 mL per hour, and so on. The grab samples can then be analyzed individually of may be mixed to obtain a composite sample, or the samples may be composited into a single vessel.
- Collection of composite samples proportional to flow rate. Individual sample aliquots can be collected proportional to the flow rate as programmed into the sampling unit and composited in a single vessel. Data collected during sampling is stored in an internal memory and can be printed only as data or as processed information in graphical form, for instance, flow versus time.
- Collection of preprogrammed incremental samples at predetermined times (such as day and night, according to temperature ranges, or regular intervals).
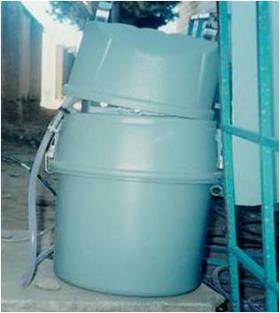
Figure 6-2. Automatic wastewater sampler.
Source: CPTS 2009.
In all cases sample point selection must consider introducing the probe to the middle of water level as it is transported through open channels or closed pipes. In order to avoid external influences, like dust, the closer the sample point is to the source or outlet, the better.
6.4.2 Manual Sampling
Manual sampling should be minimized if possible due to the potential for human errors. For instance, in a composite sample situation, where samples must be taken each hour during the day for years, it is impractical to have an operator working in this way. The best option is to install an automatic sampler as described above. The cases in which manual sampling may be acceptable are when either a grab sample is sufficient or the sampling cannot be automated, such as ORP front sampling described in Section 4.3.4.
6.4.3 Instrumentation for In Situ Analysis
Most commonly used instruments for in situ analysis can be classified into:
- Portable meters: These meters allow rapid analysis at the site where the sample is taken. Generally speaking, these devices have sufficient precision as required for standard parameters such as temperature, salinity, conductivity, pH, DOdissolved oxygen, turbidity, redox potential, and CODchemical oxygen demand.
- Permanent meters: These meters are installed in a permanent station that can measure one or more parameters constantly. The station consists of a sampling site, flow meter, sensor parameters, control unit and data logging.
6.4.4 Chemistry Sample and Analysis
The following two tables list recommended analytical methods used for field analysis (Table 6-2) and laboratory analysis (Table 6-3). Detailed descriptions of these methods can be found in Standard Methods for the Examination of Water and Wastewater (AHPA 2012; http://www.standardmethods.org).
|
Parameter |
Name and standard methods |
Description |
|---|---|---|
|
Physical parameters |
||
|
Temperature |
Thermometric: Method 2550 |
Consists of the immersion of a certified and calibrated thermometer in a water sample to establish the temperature. This parameter must be determined in situ. |
|
Conductivity |
Conductivity cell: Method 2510 B |
Conductivity is the ability of inorganic salts in solution (electrolyte) to conduct electric current. Practically pure water does not conduct current, while water with dissolved salts does. The positively and negatively charged ions allow current flow, with resistance being inversely proportional to the concentration of ions. The conductivity values are relative to a reference temperature of 25°C. This method uses a Wheatstone bridge and platinum electrodes to determine the value of the conductivity. |
|
Oxidation Reduction Potential |
Electrometric: Method 22580B |
Electrometric measurements are made by potentiometric determination of electron activity (or intensity) with an inert indicator electrode and a suitable reference electrode. |
|
Chemical parameters |
||
|
Dissolved Oxygen |
Iodimetric methods: 4500-O B 2. Membrane electrode method: 4500-O G |
1. The iodimetric test is the most precise and reliable titrimetric procedure for DOdissolved oxygen analysis. It is based on the addition of divalentHaving two available outer shell electrons, generally resulting in a +2 or -2 charge. manganese solution, followed by strong alkali, to the sample in a glass-stoppered bottle. DOdissolved oxygen rapidly oxidizes and equivalent amount of the dispersed divalent manganous hydroxide precipitate to hydroxides of higher valency states. In the presence of iodide ions in an acidic solution, the oxidized manganese reverts to the divalent state, with the liberation of iodine equivalent to the original DOdissolved oxygen content. The iodine is the titrated with a standard solution of thiosulfate. 2. Oxygen-sensitive membrane electrodes of the polarographic or galvanic type are composed of two solid metal electrodes in contact with supporting electrolyte separated from the test solution by a selective membrane. The basic difference between the galvanic and the polarographic systems is that in the former the electrode reaction is spontaneous (similar to that in a fuel cell), while in the latter an external source of applied voltage is needed to polarize the indicator electrode. Polyethylene and fluorocarbon membranes are used commonly because they are permeable to molecular oxygen and are relatively rugged. |
|
Ferrous Iron |
Colorimetric |
1. Method 1 uses individual, premeasured reagent pillows containing 1,10 phenanthroline for color development and absorbance measurement on a Hach DR/2000 spectrophotometer. This method is easily applied in the field, does not require a standard curve, does not require preparation of any reagents, is specific for ferrous iron, and has a linear range of 0 to 3 mg L"1. Analyses are conducted per the manufacturer's guidelines (Hach Company 1992). Cuvettes were rinsed with deionized water (0.1 N HC1), and a final time with deionized water between readings. Samples above the linear range should be quantitatively diluted and reanalyzed. 2. Method 2 includes the use of FerroZine in 50 mM Hepes free acid to make a FerroZine reagent. The samples are analyzed by adding 1 ml of reagent to 5 ml of sample and then adding 4 ml of deionized water. A standard curve can be developed using a blank and standards containing 1, 2, 3, and 4 mg L"1 ferrous iron. Samples with concentrations greater than 4 mg L"1 should be reanalyzed after dilution using 2 ml of sample and 3 ml of deionized water prior to addition of the reagent and additional deionized water. http://www.dtic.mil/cgi-bin/GetTRDoc?AD=ADA36119. |
|
Alkalinity |
Titration method: 2320 B |
Hydroxyl ions present in a sample as a result of dissociation or hydrolysis of solutes react with additions of standard acid. Alkalinity thus depends on the end-point pH used. |
|
Sulfide |
Ion-selective Electrode Method: 4500-S2- G |
The potential of a silver/sulfide ion-selective electrode (ISE) is related to the sulfide ion activity. An alkaline antioxidant reagent (AAR) is added to samples and standards to inhibit oxidation of sulfide by oxygen and to provide a constant ionic strength and pH. |
|
Physiochemical parameters |
||
|
pH |
Electrometric (pH-meter) or potentiometric: Method 4500 H+ |
The basic principle of electrometric pH measurement is the determination of the activity of hydrogen ions by potentiometric measurement using a standard hydrogen electrode and reference electrode. |
|
Turbidity |
Nephelometric: Method 2130 |
This method is based on the comparison of the intensity of light scattered by a sample under defined conditions or in the intensity of light scattered by a reference-standard suspension under the same conditions. |
|
Color |
Spectrometric: Method 2120 C |
The color of a filtered sample is expressed in terms that describe the sensation realized when viewing the sample. The hue (red, green yellow, or other color) is designated by the term “dominant wavelength”, the degree of “brightness” is luminance”, and the saturation is by “purity” (such as pale or pastel). These values are best determined from the light transmission characteristics of the filtered sample by means of a spectrophotometer. |
6.4.5 Sample transportation
Transport of sample containers must be made in insulated coolers containing ice or cooling material. It is worth mentioning that the use of foam will help in preventing ruptures. Containers should be kept cool, dark and in a vertical position. Upon arrival at the laboratory, a chain of custody form must be filled out by the analyst and samples should be checked according to the shipping list. Samples must be immediately stored at 4°C until analysis.
Maximum periods of storage and preservation methods prior to analysis are included in Table 6-3. In any case, it is recommended that the time interval between sample collection and analysis must be minimized.
6.4.6 Field QA/QC
The USEPA (2002) guidance for use in developing a Quality Assurance Project Plan (QAPP) when designing an environmental data collection program is commonly used and accepted.
6.4.7 Laboratory QA/QC
In order to have a trustworthy result, the laboratory should follow adequate quality assurance/quality control standards, such as those listed in Laboratory Documentation Required For Data Evaluation (USEPA 2001). Additional information can be found in Hibbert (2007).
The following principles are important to consider when making reliable analytical measurements:
- Analytical measurements should be made to satisfy an agreed requirement.
- Analytical measurements should be made using methods and equipment that have been tested to ensure they are fit for the purpose.
- Staff making analytical measurements should be both qualified and competent to undertake the task.
- There should be a regular independent assessment of the technical performance of a laboratory.
- Analytical measurements from one location should be consistent with those elsewhere.
-
Field duplicates, blanks, inter laboratory checks are important for laboratory control
- Organizations making analytical measurements should use well defined quality control and quality assurance procedures.
6.4.8 Flow Measurement Methods
Flow meters used to characterize the quantity of water, expressed as volume or mass per unit of time, are based on the fundamental equations of hydraulics (continuity equation), which are valid in open or pressure conduits:
Q = v · A
where:
Q = Volume (in units of volume/time, m3/s)
v = Velocity of fluid (in units of length/time, m/s)
A = Area through which the fluid has the velocity (v) (m2)
Flow is determined using devices or primary instruments that are calibrated hydraulic structures, installed at a driving point of the fluid. Measurements can be obtained by determining the physical variables at specific points in the structure.
It is common to use a secondary instrument to determine the actual flow passing through the point of measurement, that is, capture of the signal emitted by a primary instrument (sonic means, light, electronics) and convert that signal to hydraulic data (flow, velocity, pressure). Measuring instruments can be classified into two groups:
- direct reading without registration or indirect reading from fixed points
- digital recording or graphic
The most common method of measuring flows for pilot and full scale BCRs is in open channel or free surface flow. Flow freely exposed to atmospheric pressure, like canals can be measured from the hydraulic loads (head) across a defined structure (such as the Parshall flume, a venturi or orifice plate) and water velocity (as through a turnstile), or using thermal, magnetic, or sonic techniques.
Meters most commonly used for BCR influent, effluent and overflows in open channels are rectangular weirs, V weirs and Parshall flumes. These devices can measure flow rates of water containing a certain amount of suspended solids like those resulting from BCR treatment. (Appendix D)
6.5 Contents of an Operation and Maintenance Plan
An operation and maintenance plan (O&M Plan) should be sufficiently detailed such that a new owner/operator of the site can take over operations without encountering major gaps in understanding the bioreactor system function. The O & M Plan should include a narrative report that describes the following:
- The site background, location, and contact information
- A description of the treatment system, including schematic diagrams
- A description of flow measurement and water sampling locations and methods
- A description of routine and major maintenance activities
At least one schematic diagram of the treatment system should be provided, and more than one diagram is recommended to show detail. One of the schematics should be an aerial-view diagram (preferred scale: between 1 inch:50 feet and 1 inch:100 feet). The schematic(s) should include a legend and should clearly depict the following:
- access roads
- each major system component, labeled
- normal flow path of water through system
- flow path of water during flushing operations (if applicable)
- valves or control structures used in regular Operation & Maintenance activities
- flow-measurement points, labeled
- sampling points, labeled
- emergency spillways and other flow control structures
An example schematic diagram is shown in Figure 6-3.

Figure 6-3. Site treatment layout, example schematic.
Source: Modified from Western Pennsylvania Coalition for Abandoned Mine Reclamation, http://www.wpcamr.org/facts/groups/omr-plan/omr-schematic.pdf.
The site location should be depicted on a map and latitudinal and longitudinal coordinates should be provided, if available. Directions to the site should be provided, and the name, address and phone number of the operator should be available on site for issues regarding access and in case of emergency. Any hazards at the site should be clearly identified.
6.5.1 Site Background
The O&M Plan should identify the mine discharge and summarize its history, if known. The effluent chemistry and flow rate should be described. Changes in flow rate or chemistry over time should be described.
The O&M Plan should identify the receiving stream of the discharge. Any known sources of mining-influenced or other contaminated water flowing into the receiving stream should be identified within one mile upstream or downstream of the discharge point. The receiving stream quality prior to installation of the MIW treatment system should be described. When describing the data, the location of in-stream sampling points should be identified.
6.5.2 Treatment System
The O&M Plan should describe the treatment system’s design and construction, as well as identify costs for operation and maintenance activities.
Each major system component should be described, and the component should be assigned a unique name or identifier. A brief description of the component’s function in the overall treatment system should be provided. Any unique features or aspects of component installation should also be described.
An overall description of the flow system should be provided, and each of the flows entering or leaving the system should be described. Specific flow data from pilot testing or start-up should be included when available. The maximum design flow rate should be specified, and emergency spillways as well as other flow control or erosion control features should be identified.
A description of the system’s overall treatment process should be provided. The system performance parameters, including expected changes in pollutant concentrations, flow rates and other performance parameters should be described.
6.5.3 Flow Measurement and Water Sampling
Control of flow within the treatment system is essential to maintaining proper system function. Therefore, flow rates should be monitored wherever water enters or exits the system. Flow should be monitored before and after system components that may become clogged or lose permeability, in order to identify problems.
The O&M Plan should identify all flow measurement points in the system, the frequency of sampling and the method of flow measurement (for instance weir or bucket and stopwatch). If a weir is used, include a table or chart that convert water levels into flow measurements. For water level measurements, a built-in scale inscribed on a wall is preferred. Otherwise measurement should be made from a clearly located datum/location that is defined in the O&M plan.
The O&M Plan should identify all locations where field tests are to be performed and where water samples are collected for laboratory analysis. Sample collection methods for each type of sample should be described, including the parameters to be measured, the frequency of measurement, the appropriate containers, and preservation and storage requirements. For each sampling point, include the parameters to be measured, the frequency of measurement, appropriate containers, and preservation and storage requirements. Wherever possible, describe field tests that may serve as substitutes for laboratory tests.
6.5.4 Maintenance Activities
Passive treatment systems require regularly scheduled maintenance. For every task the system requires the O&M Plan should identify how often the task should be performed and provide instructions. For complex tasks such as system flushing, the O&M Plan should include diagrams that identify valves and control structures. The O&M Plan should specify the content of reports that document regular inspections.
Regular maintenance includes system flushing, clearing debris, and other activities necessary to control litter, vegetation, and erosion. Valves and other movable components should be exercised. If pumps or other motorized systems are a component of the system, the O&M plan should specify necessary inspection and maintenance procedures. Such activities should be included during a complete inspection of the system at least annually, though some likely need to be addressed more frequently. Some conditions such as heavy rains, the presence of animals, drought, or small acts of vandalism require special maintenance. Identify such conditions and the non-routine activities required to keep the system operating well.
The O&M Plan should include a section describing the eventual need for large-scale maintenance and replacement of system components. Damage to the system including vandalism and metal clogging, and maintenance activities including sludge excavation, substrate replacement and limestone addition are examples of activities that can be time-consuming and costly. When possible, predict the time frame for conducting major maintenance activities, and identify associated costs and funding mechanisms.
6.5.5 Health and Safety
Every BCR system should have a site specific health and safety plan (HASP) that advises inspectors of the hazards of H₂S. Liability issues prevent ITRC from including a HASP in this guidance document. The HASP should be prepared by a licensed professional familiar with the hazards.
Publication Date: November 2013