EMDs can provide unique information at each stage of the project life cycle. In many circumstances, conventional data (including current and historical contaminant and geochemical data) are insufficient to make a planned technical decision in the project life cycle. Often, decision makers pursue traditional strategies because they lack sufficient data to support alternatives that could result in remediation of equal or greater efficiency at a lower cost and in equal or less time. EMDs provide additional and often unique information that supplements conventional data.
This section provides an overview of EMDs and guidance on the following topics:
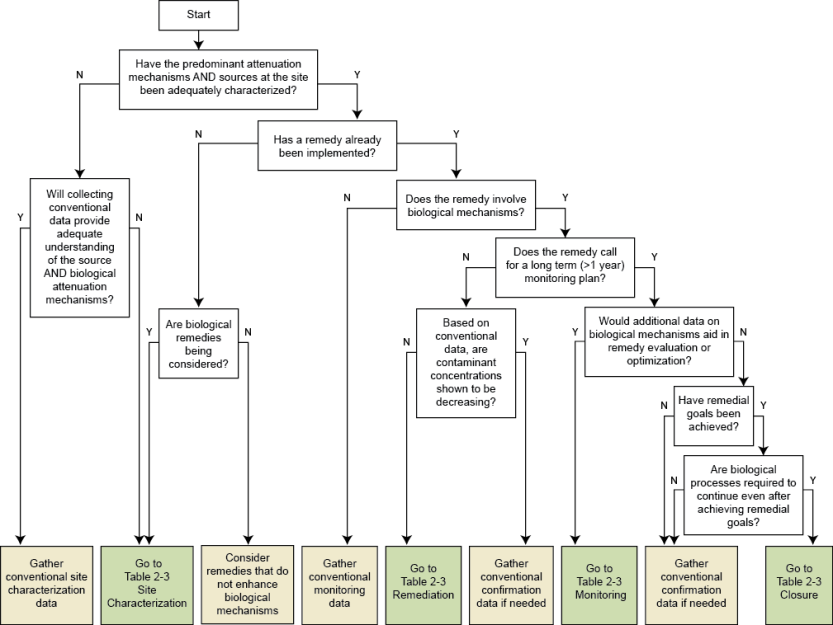
While the exact number and names of the stages may vary in different states or under different regulatory programs, most activities fall into one of four stages: site characterization, remediation, monitoring, and closure (see Section 1.2). Figure 2-1 introduces questions that EMDs can help to answer, and thereby improve project decision making over relying only on conventional data. The questions included in Figure 2-1 are only examples of the types of questions that EMDs can help to answer by providing supplemental information to the site-specific characterization data and information. The project life cycle stages are depicted as linear steps for simplicity. Often at sites the stages overlap; for example, some tasks under monitoring are conducted during what might be considered the remediation phase and some characterization tasks continue throughout the life of an environmental cleanup project.
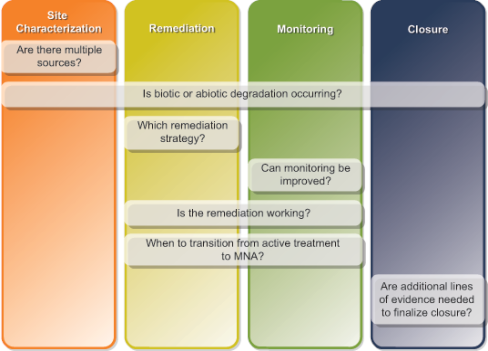
EMDs do not replace conventional data, but complement them by providing additional lines of evidence that help to explain the degradation mechanisms. While EMD data are necessary for some site management decision making (for instance, whether it is necessary to implement bioaugmentationThe introduction of cultured microorganisms into the subsurface environment for the purpose of enhancing bioremediation of organic contaminants (USEPA 2011)), all site management decisions, and in particular site closure decisions, still require traditional data gathering and interpretation. A thorough conceptual site model (CSM) should take into account all existing data (such as contaminant monitoring, geochemistry, and EMD data) and is important for understanding and interpreting the results generated by EMD methods. The CSM should reflect a current understanding of the site and uncertainties in the CSM should be explicitly acknowledged, so that proper interpretation of the EMD results can be made.
Table 2-1 summarizes the connections between conventional data and EMD data. Conventional data (for example, hydrogeological data, chemical, and geochemical analyses) often provide only indirect data regarding the mechanisms and rates of key attenuation or treatment processes. EMDs can complement these data by providing direct measurements of the organisms, genes, or enzymesAny of numerous proteins or conjugated proteins produced by living organisms and facilitating biochemical reactions (based on USEPA 2004a). involved in contaminant biodegradationA process by which microorganisms transform or alter (through metabolic or enzymatic action) the structure of chemicals introduced into the environment (USEPA 2011)., as well as relative contributions of abiotic and biotic processes and relative rates of various degradation processes. In addition, EMDs can be used to identify the source of contamination when several sources are suspected.The information that EMDs provide can improve estimates of attenuation rates and capacities and improve remedy performance assessments and optimization efforts. Improved understanding of the biological and nonbiological degradation processes also can lead to greater confidence in MNA or closure decisions.
Table 2-2 describes the benefits and limitations of the most common EMDs and how they may complement each other. One limitation among most EMDs is the limited standardization of QA/QC protocols; this is discussed more in Section 3.3 and Section 10. Table 2, Introduction to EMDs Fact Sheet, provides a comparison of the EMDs, particularly in relation to availability and relative cost. The results and interpretation for each EMD method are presented in the individual method sections of this document. At times, different EMDs can provide similar information, so use care in selecting the most appropriate and cost efficient method (see Section 2.3 and the individual EMD method sections for more information).
|
EMD (and Complementary EMDs) |
Description |
Potential benefits |
Potential limitations |
|---|---|---|---|
|
|
|
|
|
(CSIA) |
|
|
|
|
|
|
|
|
|
|
|
|
|
|
|
|
(qPCR, CSIA, Fingerprinting) |
|
|
|
|
|
|
|
|
(CSIA) |
|
|
|
In order to select among the various EMD tools available to assess site management activities and answer primary questions identified for the use of EMDs (see Section 2.3), decision makers must understand the difference between analyses that delineate the following:
In particular, an understanding of the direct connection between the information provided by a DNA-based analysis, RNA analysis, and stable isotopeTwo atoms with the same number of protons but a different number of neutrons.-based analysis is necessary to select appropriate EMD technologies.
All microbes contain DNA which is organized into genes. Each gene contains the information a microbe requires to make a single type of proteinLarge organic compounds made of amino acids arranged in a linear chain and joined together by peptide bonds (US Navy 2009).. Many proteins have catalytic activities and are called enzymes. The degradation of a specific contaminant can often be attributed to the activity of a specific enzyme and consequently, a specific gene. Some genes associated with biodegradation processes can be found in many different microorganisms. However, in some instances, the distribution of specific genes is limited to a very small range of microorganisms.
DNA-based analyses (such as qPCR, FISH, some fingerprinting methods, microarrays) detect the presence of specific genes and can determine if microorganisms capable of degrading a contaminant are present at a site. In many cases elevated numbers of specific genes can be a strong line of supporting evidence for biodegradation, although it is difficult to estimate the rates of biodegradation from DNA data alone.
Before the information in DNA can be used by the microbe to produce proteins and enzymes, the information in individual genes must be copied (transcribed) into short-lived RNA. RNA-based analyses (such as RT-qPCR, FISH, microarrays, and some fingerprinting) can therefore show that microorganisms at a site are actively expressing (transcribing) specific genes associated with specific biodegradation processes. In many cases elevated levels of gene transcription (for instance, increased RNA levels) can be a strong line of supporting evidence for contaminant biodegradation. Again, it is difficult to estimate rates of contaminant biodegradation from RNA data alone.
A few methods, such as EAPs, detect the presence of active enzymes at a site. However, these methods indirectly measure the activities of specific contaminant-degrading enzymes using surrogate compounds that are selectively transformed by contaminant-degrading enzymes into detectable products. While these methods can establish that contaminant-degrading enzymes are present and active at a site, they still do not provide unequivocal evidence for contaminant biodegradation.
The only methods currently available that can provide definitive evidence that biodegradation of a specific contaminant is occurring at a site include analyses that determine the stable isotope composition of contaminants themselves, such as CSIA, or analyses that determine whether stable isotopes derived from contaminants have been incorporated into microbial structures such as lipidsA diverse range of organic compounds that are defined as being insoluble in water but soluble in non-aqueous solvents. Lipids include oils, waxes, and sterols. or DNA (SIP).
The first step in determining if EMDs can benefit an environmental management project is to determine if the conventional chemical and geochemical data leave a data gap that an EMD method can fill. Figure 2-2 provides an initial decision framework for beginning this evaluation and leads the user to explore additional options. Specifically, Figure 2-2 points to a section of Table 2-3 based on the phase of the project (site characterization, remediation, monitoring, or closure). Within the project phase sections of Table 2-3, several primary questions often arise as part of these project phases. An “X” indicates which EMDs can be used as a primary line of evidence to answer a particular question. However, the information generated by these tools is most often used as part of a lines-of-evidence approach to understanding the site.
For eight of the 27 questions in Table 2-3, CSIA is the primary EMD used to answer the question. However, for the remaining 19 questions more than one EMD may answer the question depending on the site-specific needs and constraints. It is not necessary to use all of the EMDs identified in the table to answer a given question. Figures 2-3 through 2-9 (linked in Table 2-3 ) are decision trees that will help you to compare and decide which EMD would be the most beneficial at a particular site. In some cases, different EMDs may answer different parts of the overall question listed in Table 2-3. In those situations, supplemental questions in Figures 2-3 through 2-9 are asked to provide the user with additional information on which to base their decision. Furthermore, information regarding the commercial availability and state of development of particular EMDs are considered as well.
In addition to these supplemental decision framework figures, examples of how each question could be answered using a given EMD is presented in each EMD method section along with the details of the method, the requirements for data quality, and sampling plans with respect to the specific site requirements. You can review all of the information provided for the questions and methods of interest and determine based on their site-specific needs and constraints which method would be most suitable. The table and decision charts are intended to point you in the right direction, but may not be applicable to all sites in all circumstances. In addition, advances in EMD methods are occurring at a rapid pace, so consult with the analytical laboratory in making a site-specific decision.
In summary, for site decision making, begin with Figure 2-2 to determine if EMDs may provide information to augment conventional data. From that decision framework figure the user is directed the applicable section in Table 2-3. For 19 of the questions more than one EMD may be appropriate for the site. In these cases, consult the supplemental decision framework figure linked to the question in Table 2-3 for more information. Finally, consider the information presented in the applicable EMD method section.
The following are a few examples of common situations where EMDs can be applied to supplement existing chemical and geochemical data to provide additional insight into site conditions and additional lines of evidence for site management decisions. Additional, detailed examples are located within each of the EMD sections.
Dehalococcoides: Recent Developments
The biodegradation of chlorinated contaminants in the environment is an active area of research. The first Dehalococcoides isolate capable of complete dechlorination of PCE,‘Dehalococcoides ethenogenes’ strain 195, is capable of reductive dehalogenation of mono- and poly-chlorinated and brominated aromatic compounds, alkanes, and alkenes. (Maymó-Gatell et al. 1997).
Many Dehalococcoides strains have been isolated from geographically distinct freshwater locations (such as river sediments and aquifer materials), and exhibit differing dechlorination abilities, but share greater than 98% 16S rRNAA subunit of the ribosome composed of ribonucleic acid (RNA). The RNA sequence is used to classify and identify microorganisms (e.g. genus and species). gene sequence similarity (the cutoff typically used to classify two organisms as the same speciesThe lowest taxonomic rank, and the most basic unit or category of biological classification.(www.biology-online.org)). Specific reductive dehalogenaseAn enzyme that catalyzes the removal of a halogen atom from an organic compound. genes distinguish these different strains and confer distinct dechlorination capabilities among the strains.
Dehalococcoides mccartyi (Dhc) was recently published as the type species of the genusA category of organism classification (taxonomy). A particular genus is a group of related species. For example, Pseudomonas is a genus of bacteria. Dehalococcoides, which includes all characterized strains including strains 195, BAV1, CBDB1, FL2, GT and VS (Löffler et al. 2013). This species is the only known species with strains capable of complete dechlorination of tetrachloroethene (PCE) to ethene and inorganic chloride. More than a single Dhc strain may be included in commercially available bioaugmentation consortia. In this document, "Dhc" refers to Dehalococcoides mccartyi, including all of the strains that reductively dechlorinate chlorinated ethenes to environmentally benign ethene and inorganic chloride.