Open topic with navigation
10 Data Quality, Sampling, QA/QC, and Procedures for Biological EMDs
EMDs can provide unique information about biological at a site that can be used along with other lines of evidence to support decision making. In most cases, no formal standardized methods exist for the EMD technologies described in this document because the science of EMDs is developing rapidly. However, some common methodologies can contribute to the successful description of microbial activity at a site using EMDs. For instance, quality control procedures for CSIA are similar to procedures for traditional chemical analytical techniques and are detailed in Section 3.3. This section focuses on biological and biochemical EMDs. These EMDs are also referred to as molecular biological techniques (MBTs).
10.1 Basic Concepts
USEPA defines data quality as: “A measure of the degree of acceptability or utility of data for a particular purpose” (USEPA 2002b). Acceptability and utility are determined by sampling design and execution, as well as by laboratory practices. Some common approaches contribute to the successful qualitative description and quantitative measurement of site biological properties. This section describes the critical components of EMD approaches so that project managers can make informed decisions in the design of effective sampling plans. Using the guidance presented here, regulators can also evaluate those plans, and stakeholders can evaluate the quality of vendors’ EMD analyses and data.
Read more
Current practices for ensuring and measuring data quality occur at several steps throughout the sampling and analysis process. Data quality assessment is not solely dependent on the use of sound methodologies but also contingent on the accurate use of qualified equipment and good laboratory practices that directly impact the accuracy of the method (USEPA 2004a). Furthermore, documenting protocols and schedules for verification of the equipment performance and appropriate procedures is essential to ensure that the analysis is acceptable and will increase the confidence in a particular EMD methodology.
10.2 Project Life Cycle Stages
EMD sampling can occur at any point in the project life cycle: site characterization, remediation, monitoring, or closure. Therefore, quality considerations are critical in the remedial investigation (RI)/site assessment, feasibility study (FS)/corrective action planning, site monitoring, and closure request processes. General guidelines for sampling and QA/QC procedures will not vary between the different phases of the project life cycle, and Sections 10.3 through 10.14 are applicable regardless of life cycle phase. Some considerations specific to individual project phases are discussed in Section 10.15.
10.3 Sampling Plan
The collection of quality data begins prior to field or laboratory sampling. The hypothesis to be tested must be carefully considered and a plan which addresses that hypothesis formed.
10.3.1 Number of Samples
Read more
Statistical comparisons of data typically require a minimum of three or more samples for analysis. If three or more samples have been collected, numerous statistical methods (for example, t-test, analysis of variance (ANOVA) are available to determine differences in the means of datasets. Each method of difference determination has a corresponding formula for calculating the number of samples needed to detect differences at a pre-determined level of significance.
Determining the minimum number of qualitative analyses, such as the presence or absence of a , is more challenging. Results should be expected to be reproducible. In a limited number of cases, one sample may be construed as sufficient, but should be viewed in the context of the question being asked and the potential value of repeating the result from the same location or other locations at the site. A negative conclusion (such as ‘the at the site is NOT sufficient to support ’) may be supported with a single result, whereas a positive conclusion might require replicate analyses. Another approach may be to look at false positive and negative rates for a particular analysis and conduct a sufficient number of analyses to have a pre-determined confidence (α) that the results obtained are not false.
Replicate values are rarely obtained for EMDs due to the limited sample numbers and high cost of the analyses. This data gap may compromise data utility. For example, sample variability is likely to be high relative to other analytical processing steps and critical to understanding and predicting the performance of EMDs, and thus replicate samples are required to quantify this variability. Data quality samples such as field and equipment blanks, or matrix and trip spikes, should be added to sampling programs to detect sampling and analysis errors and cross-contamination.
Across a site, the number of samples needed will be a function of site conditions, including geology, hydrogeology, geochemistry, and contaminant distribution. A successful sampling program will incorporate these site conditions in a site specific sampling plan and consider the CSM. Greater heterogeneity (variability) in each of these site conditions will require more samples to sufficiently characterize a site.
10.3.2 Sample Locations
Read more
For EMD analysis of groundwater samples, contaminant concentrations and distribution, as well as plume size and shape, each contribute to the selection of sample locations. As with many environmental measurement techniques, multiple samples from the same location can yield differing results. These differences can be due to environmental heterogeneity, as well as variations in the sampling and measurement operations. As with the number of samples, locations for sampling the microbial community are driven by site geology, geochemistry, hydrogeology, and contaminant concentration and distribution. The contaminant concentration in groundwater, in particular, likely influences the microbial community at that location. Therefore, in addition to identifying which areas are suitable as background, the source zone and leading edge of the plume are valuable areas to apply EMDs. In these cases, contour maps and contaminant distribution isopleths can be useful resources in selecting monitoring wells for groundwater sampling. Similarly, the vertical separation of distinct aquifers and site geology (stratigraphy and lithology) is expected to impact microbial ecology and should therefore influence the selection of sample locations. The selection of sampling locations should be consistent with the CSM and the results of the EMD analysis in turn should be used to update or refine the CSM.
The rationale for selecting soil/sediment sample locations is similarly driven by variations in geology, soil chemistry, and contaminant concentration and distribution. Generally, vadose zone biology is more location-specific, because microbial transport (and thus distribution) depends on excess water. With less water available, more samples may be required to characterize a smaller area. Since in soils and sediments can vary on micro-to-millimeter scales, homogenization and multiple samples are desirable.
Variation can be characterized through replicate data collection at multiple analysis points. Once replicate samples are collected and analyzed, variation at the specific locations can be estimated. In some cases, standardization may reduce variation and thus reduce the need for replication. In other cases, replicate sample analysis will be identified as an important data quality assessment tool. These data provide insights into where variability occurs, and the degree of replication needed to provide meaningful information can be estimated using statistical tools such as power calculations. Once true variation in target microorganism concentrations can be separated from sampling and analysis variation, meaningful correlating EMD information between sites/locations becomes possible. This correlation supports the evaluation of EMD information as predictive or performance measures at sites.
10.3.3 Sampling Design Summary
Table 10-1 presents a summary of sampling design considerations.
Table 10-1. Suggestions for Sampling Plans for Number of Samples, Sample Locations and Sampling Frequency (from Lebron et al. 2011).
Table 10-1. Suggestions for sampling plans for number of samples, sample locations, and sampling frequency (from Lebrón et al. 2011)
|
Number of Samples
|
Vertical and aerial extent of plume. Border of compliance. What are the goals: source zone remediation, establishment of a biobarrier, or treatment of the entire plume?
|
The number of MBT samples is partially dependent on the volume/size of the plume and the remedial goals (for example, the cleanup target area).
|
The goal of the MBT analysis must be clearly defined. The number of samples should be sufficient to clearly establish cause-and-effect relationships, guide site management decisions, and to be accepted by regulatory agencies as a line of evidence for attenuation.
|
|
Variability of data used to characterize and delineate plume.
|
The variability of the VOC data across the plume may be an indicator of the expected variability of the MBT sample results.
|
The number of MBT samples should be sufficient to document expected variability in MBT results.
|
|
Sample Locations
|
Plume shape and expansion in relation to source area.
|
Does the plume have a simple elliptical shape emanating from a single source area or does it have an irregular shape with one or more source areas?
|
MBT samples should be collected from locations so that the results are representative of the area targeted for remediation.
|
|
Distribution of contamination within stratified/heterogeneous aquifers.
|
Is the plume contained in one homogenous aquifer or is it contained in multiple stratified aquifers separated by low permeability units.
|
MBT samples should be collected from each aquifer/unit containing the plume.
|
|
Distribution of indicator parameters throughout the target area (such as biodegradation products, DO, ORP).
|
Does the distribution of indicator parameters, such as biodegradation products, oxygen, and ORP, indicate that there are distinct biodegradation zones in the plume? Are there distinct biodegradation zones in the plume?
|
MBT results must be performed in an integrated manner and include site geochemical parameters collected simultaneously. At least one sample should be collected from each distinct biodegradation zone.
|
|
Sample Frequency
|
Seasonal variability of groundwater data (VOCs, oxygen, ORP).
|
Is there seasonal variability of the existing groundwater data, such as VOC concentration, oxygen, and ORP, that indicate the potential for seasonal variability of the MBT data?
|
The sample frequency should be sufficient to document expected seasonal variability of MBT results.
|
|
For active remediation systems, frequency of injection, observed biodegradation rates, location of monitoring wells relative to injection points and groundwater flow velocity, and remediation goals.
|
For enhanced bioremediation performance monitoring, a baseline should be established prior to any treatment. Donor injection will rapidly affect the richness and eveness of the microbial community.
|
Sampling should be conducted more frequently (monthly or quarterly) following to monitor the distribution of dechlorinators and the establishment of dechlorinating activity in the target area.
|
10.4 Sampling
Biomass in environmental matrices can be collected in a variety of ways for EMD analysis. This section discusses general considerations for EMD sampling, the application of active and passive approaches, as well techniques specific to different matrices. Health and safety considerations for EMD sampling are similar to soil and groundwater sampling for conventional parameters and should be included in the site health and safety plan.
10.4.1 Aseptic Sampling and Sterility
Read more
Sampling materials (such as instruments, passive sampling devices, filters) should be sterilized prior to use in the field. Field personnel should be adequately trained in maintaining the sterility of sampling devices and practicing technique. In cases where it is impractical to maintain sterile conditions, effort should be taken to minimize the introduction of microbial contamination. Samples should also be handled accordingly and shipped on ice as soon as possible to prevent or minimize changes in microbial abundances or activities during the time interval between sample collection and analysis.
Steps to ensure that field sampling equipment does not contribute contamination include:
- Use bleach solution as part of the decontamination for soil sampling equipment such as augers.
- Use disposable or dedicated tubing/samplers.
- Use lab-sterilized bottles and sampling devices.
10.4.2 Active Groundwater Sampling
Read more
To monitor microbes of interest such as Dhc (a of bacteria that dechlorinate chlorinated solvents) in aquifer formations, groundwater samples are typically collected due to the practical limitations to routinely collecting soil samples from the saturated zone. In the case of Dhc, a significant fraction (over a third) of the total Dhc are found in the aqueous phase, in addition to Dhc cells attached to the solids (Frank Löffler, University of Tennessee, personal communication; Amos et al. 2009; Schaefer et al. 2009). Most EMDs call for on site filtration to collect biomass from groundwater (Ritalahti et al. 2010a). A guidance protocol providing a step-by-step approach for groundwater sampling using field filtration methods was developed as part of the Environmental Security Technology Certification Program (ESTCP) Project ER-0518 and is available in Lebrón et al. (2011) and Ritalahti et al. (2010b).
Note that other subsurface microorganisms may form biofilms and are primarily attached to aquifer solids; groundwater analyses alone may not reflect the true abundance of such organisms in the aquifer formation (Alfreider et al. 1997; Griebler et al. 2002, 2009; Hazen et al. 1991; Thomas et al. 1987). In these cases, sampling aquifer solids may be necessary, or use of passive sampling devices with solid matrices to encourage microbial biofilm development may be more appropriate (Sublette et al. 2006). Although the analysis of groundwater and solid samples is required to obtain the total numbers of target cells in the aquifer formation, groundwater samples alone will be useful for estimating cell numbers of organisms that occur in the non-attached state (for example, Dhc).
10.4.3 Passive Groundwater Sampling
Read more
Passive microbial sampling devices, also called retrievable media devices, are typically deployed in purged groundwater monitoring wells located within and upgradient of the dissolved contaminant plume to compare results of analyses between impacted and background conditions (see Lebron et al. 2008).
Passive microbial sampling devices are incubated within the sampled environment for several weeks (typically 30-60 days or more) and rely on the formation and collection of biofilms on or within a solid matrix. See also Section 10.4.5 for more information about the devices themselves. Passive microbial sampling can provide a time-integrated sample of microorganisms from the sampled environment. Passive samplers can also be amended with electron donors or acceptors or with isotopically-labeled contaminant compounds (see Section 7) to assess in situ microbial activities (Lebron et al. 2008).
Advantages of passive microbial sampling devices include ease of storage and transport, capture of sufficient biomass for EMD analysis, and a potentially more accurate temporal and spatial representation of the subsurface microbial community surrounding the site of collection than can be gleaned from groundwater samples (Peacock et al. 2004). A disadvantage of passive microbial sampling devices includes the uncertainty as to whether the sampling device represent groundwater geochemistry and the physical conditions of the aquifer matrix, and hence, truly represent the (i.e., richness and evenness) of the surrounding aquifer. These factors must be considered when interpreting the data, in particular when quantitative information is evaluated. Questions surrounding suitable incubation times are another issue with passive microbial sampling devices that have not been thoroughly addressed.
10.4.4 Soil Sampling
Read more
Soil samples can contain high concentrations of diverse bacteria and other biota. A soil sample, much like a single groundwater sample, can be viewed as a ‘snapshot’ in both time and space. Do not necessarily assume that the sample is in biological or chemical equilibrium. Avoid contamination of the sample with bacteria from other locations and sampling devices. Field blanks can offer a quality control check to detect the presence of interfering bacteria.
10.4.5 Sampling Devices
Read more
Various active and passive microbial sampling devices have been developed to collect microorganisms from an environment (typically groundwater) for analysis using EMDs. Active microbial sampling devices are used to collect a grab sample of the microbial community from a particular point in time. Passive microbial sampling devices provide a time-integrated sample of the microbial community. Both methods, when combined, can be used to assess monitored natural attenuation and evaluate enhanced bioremediation alternatives.
Active: Various biomass extraction/filtration approaches are available for collecting active microbial biomass from environmental media. Collecting biomass samples using filtration techniques is preferable to the common practice of collecting and shipping chilled groundwater samples for most EMD techniques (Ritalahti et al. 2010b). Field filtration approaches involve low-flow groundwater purging and sampling from monitoring wells, using the same methods that are generally recommended when sampling for volatile organic compounds. In this process, representative groundwater is passed through a filter (for example, Sterivex™), which isolates biomass from the sample. The filter (not the sampled groundwater) is then shipped overnight on ice to a laboratory for analysis. The ESTCP Guidance Protocol available under ER-0518 provides a step-by-step approach to groundwater sampling using field filtration methods (Lebron et al. 2011).
Passive: Passive devices are groundwater sampling tools (such as biofilm coupons, in situ microcosms, groundwater dialysis chambers, porous beads, Bio-Trap® samplers) that facilitate subsurface microorganisms colonizing onto a retrievable matrix. Biofilm coupons, are an artificial growth surface used to monitor biofilms in disparate environments. However, passive microbial sampling devices are not quantitative, since it is difficult to relate microbial concentrations in the groundwater or aquifer matrix to those detected on the passive devices because of biases imparted by the sampling media (Lebron et al. 2008).
EMD samples need to be transported in sterile containers, to the extent possible, to reduce the likelihood of biota associated with the container being detected in the sample.
Examples of sampling devices are included in Figures 10-1 and 10-2.
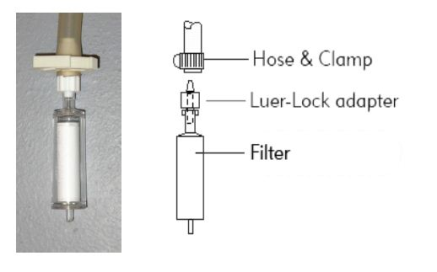
Figure 10-1. Groundwater sampling flow through filter.
Source: Microbial Insights 2012,http://www.microbe.com/images/stories/er/sampling/er_bio-flo_protocol_dna_mi.pdf.
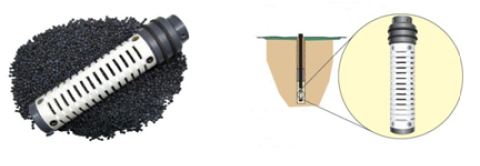
Figure 10-2. BioTrap® passive microbial sampling devices.
Source: Microbial Insights 2012,http://www.microbe.com/index.php?option=com_content&view=article&id=76:bio-trap-samplers&catid=19:bio-trap-samplers&Itemid=33.
10.5 Sample Preservation
Sample preservation conditions upon receipt at the laboratory should be reported with any EMD analytical shipment. Sample preservation is critical for EMD analysis, as it is for chemical analysis. The approach to sample preservation depends on whether the material analyzed is DNA, RNA or whole cells (microbial activity).
10.5.1 DNA
Read more
While DNA is considered to be relatively stable, it is subject to degradation, which would impact the integrity of samples and the accuracy of subsequent testing in the analytical laboratory. In general, DNA degradation is enhanced under high temperatures, acidic or alkaline conditions, and the activity of , that specifically degrade DNA (Lebron et al. 2008).
Freezing of soil cores, including in situ freezing during core collection has been demonstrated effective for preserving DNA in environmental samples for analyses (Johnson 2012). Storage at -80°C was shown in the same study to produce statistically equivalent results from DNA analyses following a storage period of five months, and may be preferable for some applications.
Preservatives may increase the stability of DNA in groundwater, thereby increasing the accuracy of the downstream analysis and potentially allowing for increased hold times (i.e., storage of groundwater prior to biomass collection). However, this practice is not common, and preservatives are not currently used in direct groundwater sampling methods. If samples are not frozen, regardless of whether preservative is used, samples should be shipped cold (4°C) and received by the analytical laboratory the following day (i.e. guaranteed overnight delivery, confirm with the laboratory that staff will be able to process the shipment on the day delivered).
10.5.2 RNA
Read more
Samples collected for assessment of RNA activity should be preserved either with a commercially-available preservation solution, or by freezing at -80°C. Samples should not be frozen if preservative is added. Like DNA, freezing of soil cores, (including in situ) has also been demonstrated effective for RNA analyses (Johnson 2012). Storage at -80°C was shown in the same study to produce statistically equivalent results from RNA analyses following a storage period of five months. As with DNA, freezing groundwater samples in the field and storage at -80°C are logistically difficult. Alternative approaches should be carefully evaluated and at a minimum, samples should be shipped cold (4°C) by overnight delivery.
An exception to the preference for freezing of DNA or RNA samples involves the use of passive microbial sampling devices. Passive microbial sampling devices are typically deployed in groundwater monitoring wells for an incubation period of 30-90 days. Samplers are then recovered and shipped overnight on ice for analysis. Commercial active and passive microbial sampling devices are assembled under sterile conditions and shipped in sterile containers. After sampling, both types of samplers should be shipped cold (4°C) by overnight delivery to their respective locations for analysis. If recovered passive microbial sampling devices were naturally frozen, they must not thaw en route to the laboratory for analysis.
10.5.3 Whole cells
Read more
If samples are to be analyzed for microbial activity (such as enzyme activity probes) the samples should not be frozen or treated with preservatives as both can lead to lysis (destruction of living cells) with a concurrent loss of activity. Samples should be shipped cold (4°C) by overnight delivery. Transit times and time from receipt to analysis at the laboratory should be evaluated with data from whole cell analyses.
10.6 Complementary Traditional Site Characterization Data
Site specific data determined by more traditional analytical techniques are essential to interpretation of EMD results. EMD results that are consistent with site understanding based on traditional analytical techniques increases confidence in EMD data quality and appropriate technique selection. The traditional parameters that aid in interpretation of EMD data include site specific geology, hydrogeology, biogeochemistry, and water chemistry, as well as concentration trends for the contaminant.
Read more
10.6.1 Biogeochemical parameters
The success of nearly all in situ technologies depends on adequate characterization of site hydrogeology. Important determinations include which parts of an aquifer are connected, whether the aquifer is confined or unconfined, what the relative permeability and dispersivity of various portions of the aquifer are, the direction and flow rate of groundwater (gradient), and seasonal considerations (change in groundwater flow direction or influence of aquifer recharge events). For example, the EMD analysis of groundwater collected in one portion of an aquifer may be of limited use in assessing the microbiology of a different portion of the aquifer.
10.6.2 Hydrogeological parameters
Readily available groundwater chemistry tests of provide the context in which to understand EMD data. Biogeochemical parameters such as pH, oxidation-reduction potential (ORP), and dissolved oxygen complement EMD data by indicating whether or not conditions are favorable for the desired microbially-mediated reactions (ie., oxidation of fuel hydrocarbons or reductive dehalogenation of chlorinated organics) and microbial communities. Additionally, measures of dissolved species such as nitrate, nitrite, ferrous and ferric iron, sulfate, sulfide, and methane, can provide additional insight into the prevailing ORP and the abundance of and electron donors.
10.6.3 Water quality parameters
Water quality parameters such as total dissolved solids (TDS), total organic carbon (TOC), and chloride content can also be indicators of the likelihood of enhancing microbial activity at a site.
10.6.4 Concentration trends
Knowledge of how the concentration or mass of the contaminant has changed over time can be used to evaluate the remedial approach, but it can be difficult to determine in the presence of separate phase (sorbed or non-aqueous liquid) materials. CSIA, as discussed in Section 3, can be an effective tool in this scenario. Where the contaminant is exclusively dissolved, the change in the aqueous phase concentration of the contaminant over time is an important factor in interpreting EMD results at the site. Favorable EMD results typically coincide with or precede favorable contaminant concentration or geochemical trends.
As discussed previously, the location of the contaminant concentrations within the aquifer or soil provides the context for any EMD data which is collected. This effect may be particularly pronounced when there are separate phase (LNAPL, DNAPL) constituents or when the constituent has an inhibitory and/or toxic effect on the microbial population (for example, elevated 1,1,1-TCA concentrations). Contaminant concentrations can also enhance the distribution of some microorganisms. Other variables can also provide important spatial context for EMDs such as aquifer solids or locations of groundwater/surface water interactions.
10.7 Method QA/QC
In the field, current practices recommend, but do not require, data quality samples such as field blanks, equipment blanks, matrix blanks, and trip blanks. The inconsistent use of data quality samples creates problems in identifying erroneous data, such as samples affected by cross contamination or deterioration during shipping.
Of the biological EMDs, only PCR-based methods have USEPA guidance related to laboratory quality: “Quality Assurance/Quality Control Guidance for Laboratories Performing PCR Analyses on Environmental Samples” (USEPA 2004a). This document provides a good example of a detailed QA analysis for a particular laboratory method. The document’s guidance could be extrapolated to those laboratories performing qPCR for environmental remediation applications. When considering those EMDs not based on PCR, this document still provides many meaningful QA/QC considerations. Additional QA/QC guidance can be obtained from the USEPA qPCR method for Enterococci: “Method A: Enterococci in Water by TaqMan® Quantitative Polymerase Chain Reaction (qPCR) Assay” (USEPA 2010).
10.8 Known Biases (Extractions, PCR, Microbial Ecology)
Bias is a measure of agreement or disagreement between the concentration of an analyte as measured by a method and the true concentration in the environmental sample. Each EMD may have biases specific to the methodology. Please refer to the individual EMD sections for discussion of these biases. Because DNA extraction and amplification support several of the EMDs, some common biases are presented here.
Read more
Any analysis involving the extraction of DNA from an environmental sample should consider how selective or incomplete DNA extraction might impact results and their interpretation. The inability to accurately sample DNA from the entire microbial community in soil is generally accepted by the scientific community. Some DNA extraction methods tend to favor more abundant species over less abundant ones, or may be selective for particular groups while other groups may remain unnoticed (Feinstein et al. 2009; Inceoglu et al. 2010; Lipthay et al. 2004). Humic substances and other compounds common in soils and sediments may also inhibit PCR amplification or interfere with analyses (see Wilson 1997 for review). Moreover, DNA purification procedures may also result in a loss of DNA or may impact the efficiency of subsequent amplification (Roose-Amsaleg et al. 2001). On the other hand, recent evaluation of SIP analyses indicates that "multiple DNA extractions on soil samples improves the extractable DNA yield and the number of quantifiable eubacterial copies, but have little qualitative effect on the identification of the bacterial groups associated with the degradation of a given carbon source" (Jones et al. 2011). There is considerable scientific uncertainty about the value of the "rare but potentially important" species that may be under-represented with some EMDs (especially for long term natural attenuation). For example, it is possible that important contaminant degrading microorganism may not be dominant when EMDs are used to assess the microbial community at a contaminated site and may be overlooked.
Bias can also occur when using PCR to amplify certain target DNA sequences due to properties of the target (such as the concentration of DNA to be amplified), the flanking sequences, or the overall genome. Additional bias may also be introduced depending on the type of used, polymerases used, and the reaction conditions of the amplification process. The DNA replication process itself is not always perfect and may result in errors, such as deletions or additions of incorrect nucleotide bases. Bias also occurs when the amplification efficiencies of target sequences are not the same (that is, when some copies of PCR products are not amplified in subsequent cycles). Reporting sufficient information to address known sources of potential bias is recommended as part of QA/QC procedures. For additional information on recommended reporting procedures, see the recommended information requirements table contained in each EMD section (for qPCR example, see Section 4.3.1).
10.9 Blanks/Contamination Controls
Laboratory procedures can inadvertently introduce the substance to be detected into an otherwise uncharacterized sample. Such contamination, sometimes referred to as “cross contamination”, is of particular concern in DNA-based methods due to their sensitivity. Cross contamination is also a problem in methods involving live cells due to the possibility that those cells may replicate during transport and handling or that cells may lyse and have their cellular contents degraded (e.g., via the action of nucleases).
The ability to evaluate a blank and reference control is a critical QC criterion for all methods, and the extent to which the blank has followed the path of the uncharacterized sample can make results more convincing. Blanks should be reported with any analytical batch.
10.10 Positive Controls
A positive control shows that, in the presence of the substance to be analyzed, the test returns a positive result. Positive controls provide one indication that the test or measurement is working properly and can be relied on to detect the presence of a substance and potentially a measure of its quantity. This approach can be either qualitative or quantitative to evaluate the procedures employed. Positive controls should be reported with any analytical batch. Data from analyses where any positive control fails should be discarded. As an example, positive controls for qPCR should include a qPCR amplification positive (a DNA source that can be amplified by the same primer as the target sequence, analogous to a known concentration gas chromatography standard), and matrix spike samples.
10.11 Negative Controls
A negative control shows that, in the absence of the substance to be analyzed, the test returns a negative result. Negative controls provide another indication that the test or measurement is working properly and can be relied on to provide a negative result or measurement of non-detect in the absence (or presence at a concentration below the detection limit) of a substance. Negative controls should be reported with any analytical batch. Data from analyses where any negative control fails should be discarded. As an example, negative controls for qPCR should include a DNA extraction negative (DNA-free water) and a qPCR amplification negative.
10.12 QA Metrics for Qualitative Analyses
The key metrics of qualitative analyses are the rates of false positives and false negatives. As a laboratory conducts positive and negative controls for a given analysis, it should track the rate at which those controls indicate the analysis has failed. In controlled laboratory conditions, these rates should be low, but they should be measurable. These rates should be available on request from the analytical laboratory.
The false positive and false negative rates may be used to estimate the number of results needed to confirm an initial result at a predetermined level of confidence. For example, if the combined false positive and false negative rates total 10%, multiple analyses should be required in order to reach a pre-determined confidence of 0.05 (5%).
10.13 QA Metrics for Quantitative Analyses
The acceptability and utility of quantitative analyses are routinely evaluated according to several standard measures. This section discusses how to apply the standard measures of precision, accuracy, completeness, representativeness, comparability, and sensitivity to EMDs.
Read more
10.13.1 Precision
Precision is the degree to which a set of observations or measurements of the same property, usually obtained under similar conditions, produce the same result—how reproducible is a measurement? (USEPA QA Glossary). Precision is usually expressed as standard deviation, variance, percent difference, or range, in either absolute or relative terms. Determining precision typically requires both field and laboratory duplicate samples (for example, minimum of one sample for each field sample and laboratory negative or positive reference controls). Additional considerations of precision for each EMD are discussed in the individual EMD method descriptions as needed.
10.13.2 Accuracy
Accuracy is the degree of agreement between an observed value and an accepted reference value. Accuracy includes random error (precision) and systematic error (bias or recovery) that are caused by sampling and analysis. Accuracy is typically reported as percent recovery of laboratory control samples, in relation to a method reporting limits. Additional considerations of accuracy for each EMD are discussed in the individual EMD method descriptions as needed.
10.13.3 Representativeness
The degree to which data reflects actual site condition may need to be considered. Field sampling biases and biases associated with laboratory methods may need to be addressed to maintain consistency with the data quality objectives, conceptual site models, or remedial objectives. Representativeness should be judged for the study design, specifically the location, number, and frequency of samples.
10.13.4 Comparability
Typically, data comparability includes correlation between field and laboratory data. However, it may also include correlation between procedures, quantitation units, and reporting formats between laboratories. Pay careful attention to the relevance of positive and negative controls to the field samples being tested. For example, is laboratory-grade water a valid substitute for site groundwater?
10.13.5 Completeness
Completeness can include the number of valid (usable or non-rejected) results in relation to the total number of results. Some regulatory agencies may have minimum completeness goal for each project (e.g., 85% minimum completeness). Completeness can be judged by comparing the planned number of samples and the valid results obtained. Failure to meet completeness criteria can lead to questions about whether the data obtained is sufficient to support the hypothesis.
10.13.6 Sensitivity
Sensitivity can involve limits of detection by the procedures employed (e.g., method detection limit, quantitation limit ) and a determination if they meet project goals. Trip blank or lab blank results are often used to report/indicate quantitation limits. Sensitivity of the analysis should be reported in some way with each data package where relevant.
10.14 Reporting
Data from any analysis must be communicated in a manner that not only expresses the results of an analysis but also provides adequate supporting information to determine the acceptability and usability of the result. Where possible, EMDs should meet the same conceptual data quality standards as other environmental analyses.
Read more
10.14.1 Laboratory Reporting
The laboratory report should provide data to address the relevant quality control issues described in this chapter to the extent possible. Each method section of this guidance includes information about laboratory reporting requirements (e.g., for qPCR see Section 4.3.1). In addition, an example of a detailed checklist of report requirements is the Minimum Information for Publication of Quantitative Real-Time PCR Experiments (MIQE) (Bustin et al. 2009). These guidelines "target the reliability of results to help ensure the integrity of the scientific literature, promote consistency between laboratories, and increase experimental transparency" (Bustin et al 2009).
Reports typically include a laboratory data verification and quality assurance summary from the laboratory performing the analyses. For example, a qualitative analysis should report the associated blank, positive control, and negative control as well as, potentially, the overall false positive and false negative rates for a given analysis. Similarly for quantitative analyses, sufficient data should be provided so that the sensitivity, precision, and accuracy of that analysis can be determined.
10.14.2 Study Reporting
The study report should compile laboratory QC data and address all QA parameters related to the relationship among samples (i.e., representativeness, comparability, and completeness). Ideally, these factors will be presented in the relevant work plan and follow through the study report.
10.15 Project Life Cycle Specific Considerations
EMDs can improve site management at several points in the project life cycle. Any point where questions are raised regarding the site biological activity, EMDs should be considered.
10.15.1 Site Characterization
Read more
With EMDs, site characterization can include an appraisal of the site's microbial community (e.g., presence of degraders or overall community composition) and its real or potential microbial activity. When evaluating the spatial variation of a microbial species or activity using an EMD, it is important to collect a sample from an unaffected area for comparison. The USEPA document, “Guidance for Comparing Background and Chemical Concentrations in Soil for CERCLA Sites” (USEPA 2002a), provides guidance on selecting a reference area that can be applied to EMDs. The statistical methods detailed in this guidance can also be used for quantitative EMDs (e.g., qPCR). Statistical comparisons require that both background and on-site datasets are sufficiently large for the statistical tests. Biological systems also vary temporally (seasonal and even daily cycles) and sampling programs should reflect this by being contemporaneous if possible and avoiding seasonal extremes.
10.15.2 Remediation
Read more
EMDs can contribute lines of evidence to corrective action plans and FSs to support the selection of active bioremediation and/or natural attenuation strategies. Criteria for the number and location of samples are similar to those described for site characterization (Table 10-1).
Baseline. Similar to background, when evaluating a change in a given EMD over time or related to treatments that occur over time, it is important to have data that represent the range of values ‘before’ a treatment or event so that they may be contrasted with ‘after’. Since samples are collected from single points in time, the data are representative “snapshots” of the microbial community. Thus, ongoing sampling events are typically used to describe how microbial conditions vary over time.
Assessing Progress at the Site. EMDs can be applied to answer site specific questions such as: Does this amendment stimulate microbial activity in the manner anticipated? Will an amendment promote biodegradation appreciably above what would be achieved using MNA? Did the bioaugmentation culture remain active? Was there a shift in the dominant members of the microbial community? While a detailed discussion of these possibilities is beyond the scope of this section, it is important to consider the specific question applicable to the site and determine how directly relevant the data are. In most cases, EMDs will provide inferential data about the biological status of a site that relate to site geochemistry and contaminant fate rather than provide conclusive proof of a particular activity or outcome. Consequently, EMDs are typically used in conjunction with other data to provide multiple lines of evidence for a decision.
Remedial Optimization. In pilot testing or in efforts to improve the performance of biologically-based, or chemically-based treatment systems, EMDs can provide key insights into the composition and response of the microbial community in key areas of the site. Criteria for the number of samples collected are similar to those described for site characterization and baseline measurements (Table 10-1). As previously stated, EMDs are not a substitute for collecting and evaluation of more conventional site metrics. Physical and chemical knowledge of the site is essential for interpreting EMD data. EMDs should complement existing chemical and physical information about the site.
10.15.3 Monitoring
Read more
When EMD data are being used to guide site activities, there may be an ongoing need for EMD testing to establish the stability or trend for an organism or degradation gene associated with site contaminants. Anytime testing is repeated, the frequency of that testing should be appropriate for the parameter being tested.
10.15.4 Closure
Read more
It may be possible for a site to achieve closure without meeting regulatory cleanup criteria if cleanup goals can be achieved in a ‘reasonable’ time frame, or there are no receptors or pathways for contaminant exposure. Though predictions regarding biodegradation may be based on observed degradation rates, EMDs can add key supporting information. In addition to the current rates, estimates of the stability of those rates are implied in the closure scenario. The composition of the microbial community, as identified by various EMD data may complement other lines of evidence that suggest biodegradation is likely to continue, and that a biodegradative process are likely sustainable. As discussed in Section 10.15.2, the persistence of biodegradation is difficult to predict, but it may be critical to a prediction of the timeframe for remediation. However, it may be prudent to continue monitoring with EMDs for an extended period to demonstrate the stability of a microbial community or activity.
Some EMDs can aid in estimating biodegradation rates (CSIA and the Rayleigh equation in particular as discussed in Section 3.3.3.2, Question N). Care must be taken, however, in extrapolating rates both spatially and temporally. Although a change in number of gene copies, or number of microorganisms in a given sample, could be used to infer that biodegradation is occurring, currently there is no quantitative method to calculate a rate of biodegradation from a detected number of gene copies per liter.
10.16 Specialized Application Consideration
EMDs may also answer site-specific questions that do not fit in the preceding sections.
Read more
10.16.1 Presence, abundance, activity
Among the site management questions related to remedy selection and implementation, particularly monitored natural attenuation, there are some distinctions that must be drawn among the types of data that are available and whether they are related to presence, abundance, or activity.
Presence
When the question is simply whether or not a type of microorganism or a functional gene is present at a site, a qualitative test such as PCR, of the microorganism’s presence or absence will suffice.
Abundance
If some indication of how much of a given microbe or gene is present at a site, a quantitative analysis is needed, such as qPCR.
If the question involves how much gene expression is occurring at a particular moment in time, quantitative activity analyses such as RT-qPCR and EAPs are needed. However, there are no quantitative methods to calculate a degradation rate from a detected number of gene copies per liter, though an emerging approach uses the number of gene copies, or counts of number of the organisms, to potentially infer degradation rates.
Activity
Contaminant fate and transport modeling, in addition to a scheduled time-series sample collection and analyses program can also help to predict contaminant fate or biodegradation rates.
Was there a shift in the dominant members of the microbial community? While a detailed discussion of these possibilities is beyond the scope of this section, it is important to consider the specific questions applicable to the site, and determine how directly relevant the data are. In most cases, EMDs will provide inferential data about the biological status of a site that relate to site geochemistry and contaminant fate rather than provide conclusive proof of a particular activity or outcome.
Monitoring through seasonal changes or changes in groundwater elevation along with known trends may be beneficial in predicting the stability of biological activity. Ultimately, ongoing monitoring suggests the stability of any measured effect, and it will be a matter of judgment whether anticipated changes in site conditions are likely to change biological activity.
10.16.2 Frequency of EMD sampling
The frequency of EMD sampling depends on the hypothesis being tested. Default quarterly and semi-annual groundwater monitoring schedules have been used and been able to show changes in microbial communities and activity. In some cases, more frequent sampling may be desirable.
As an example, bioaugmentation may be confirmed by sampling as little as a week after injection. It is recommended that EMD sampling be conducted more frequently (e.g., monthly or quarterly) immediately following bioaugmentation, "to monitor the distribution and proliferation of dechlorinating bacteria (i.e., Dhc) in the treatment area" (Lebron et al. 2011). Changes in amendments may also show results quickly. Considering seasonal changes in site characteristics (e.g., predominant groundwater flow direction) may also be appropriate. Regardless of sampling frequency, "two years of quarterly monitoring are recommended during bioremediation implementation" (Lebron et al. 2011). High costs associated with some methods (EAP, SIP, and FISH) may lead to less frequent sampling.
10.16.3 Trends in EMD data
A number of statistical approaches can be used to decipher trends regarding quantitative analyses (e.g., qPCR, EAPs, and FISH).These approaches are discussed in detail in “Guidance for Data Quality Assessment Practical Methods for Data Analysis: EPA QA/G-9” (USEPA 2000). Trend analysis is not possible for qualitative measures.
10.16.4 Low contaminant concentration sites
At sites where MNA is the chosen remedy for chlorinated ethenes, it is important to select groundwater sample locations "where total VOC concentrations are at least 100 µg/L" (Lebron et al. 2011). At locations where VOC concentrations are less than 100 µg/L, "organohalide-respiring bacteria may not be present in high numbers due to low (chlorinated ethenes) concentrations" (Lebron et al. 2011).
Therefore, immediately after bioaugmentation, "MBT sampling should be conducted more frequently (e.g., monthly or quarterly) to monitor the distribution and proliferation of dechlorinating bacteria" (i.e., Dhc) in the treatment area (Lebron et al. 2011). Regardless of sampling frequency, two "years of quarterly monitoring are recommended during bioremediation implementation" (Lebron et al. 2011).
10.17 Summary
The absence of standard methods for analysis of molecular EMD tools necessitates strict adherence to a rigorous QA/QC plan. Success of an EMD application will depend on several factors, including the following:
- development of a site specific sampling plan for spatial extent and frequency that is developed in response to project goals
- use of appropriate sampling methodologies, including selection of active or passive sampling, preventing sample contamination, and sample handling practices that preserve the microorganisms or nucleic acids depending on the selected EMD
- appropriate use of blank, control and duplicate samples to provide controls of sources of error in sampling and analysis
- adaptation of sampling and EMD tool selection to the site project life cycle
Open topic with navigation