The goal of DNAPL ISC is iterative development of a CSM with sufficient depth and clarity to evaluate risks and develop appropriate remediation strategies.
Integrated site characterization is a process for improving the efficiency and effectiveness of characterization efforts at DNAPL sites. It encourages characterization at a sufficient resolution to capture the effects of the heterogeneities that direct contaminant distribution, fate, and transport, and remediation effectiveness, so that an integrated three-dimensional CSM can be developed and refined. The CSM should distinguish among transport and storage zones and identify relevant mass.
DNAPL sites have too often been characterized at a resolution insufficient for this understanding, and it is therefore reasonable to equate ISC with high
New Concepts for the Evaluation of Fate and Transport
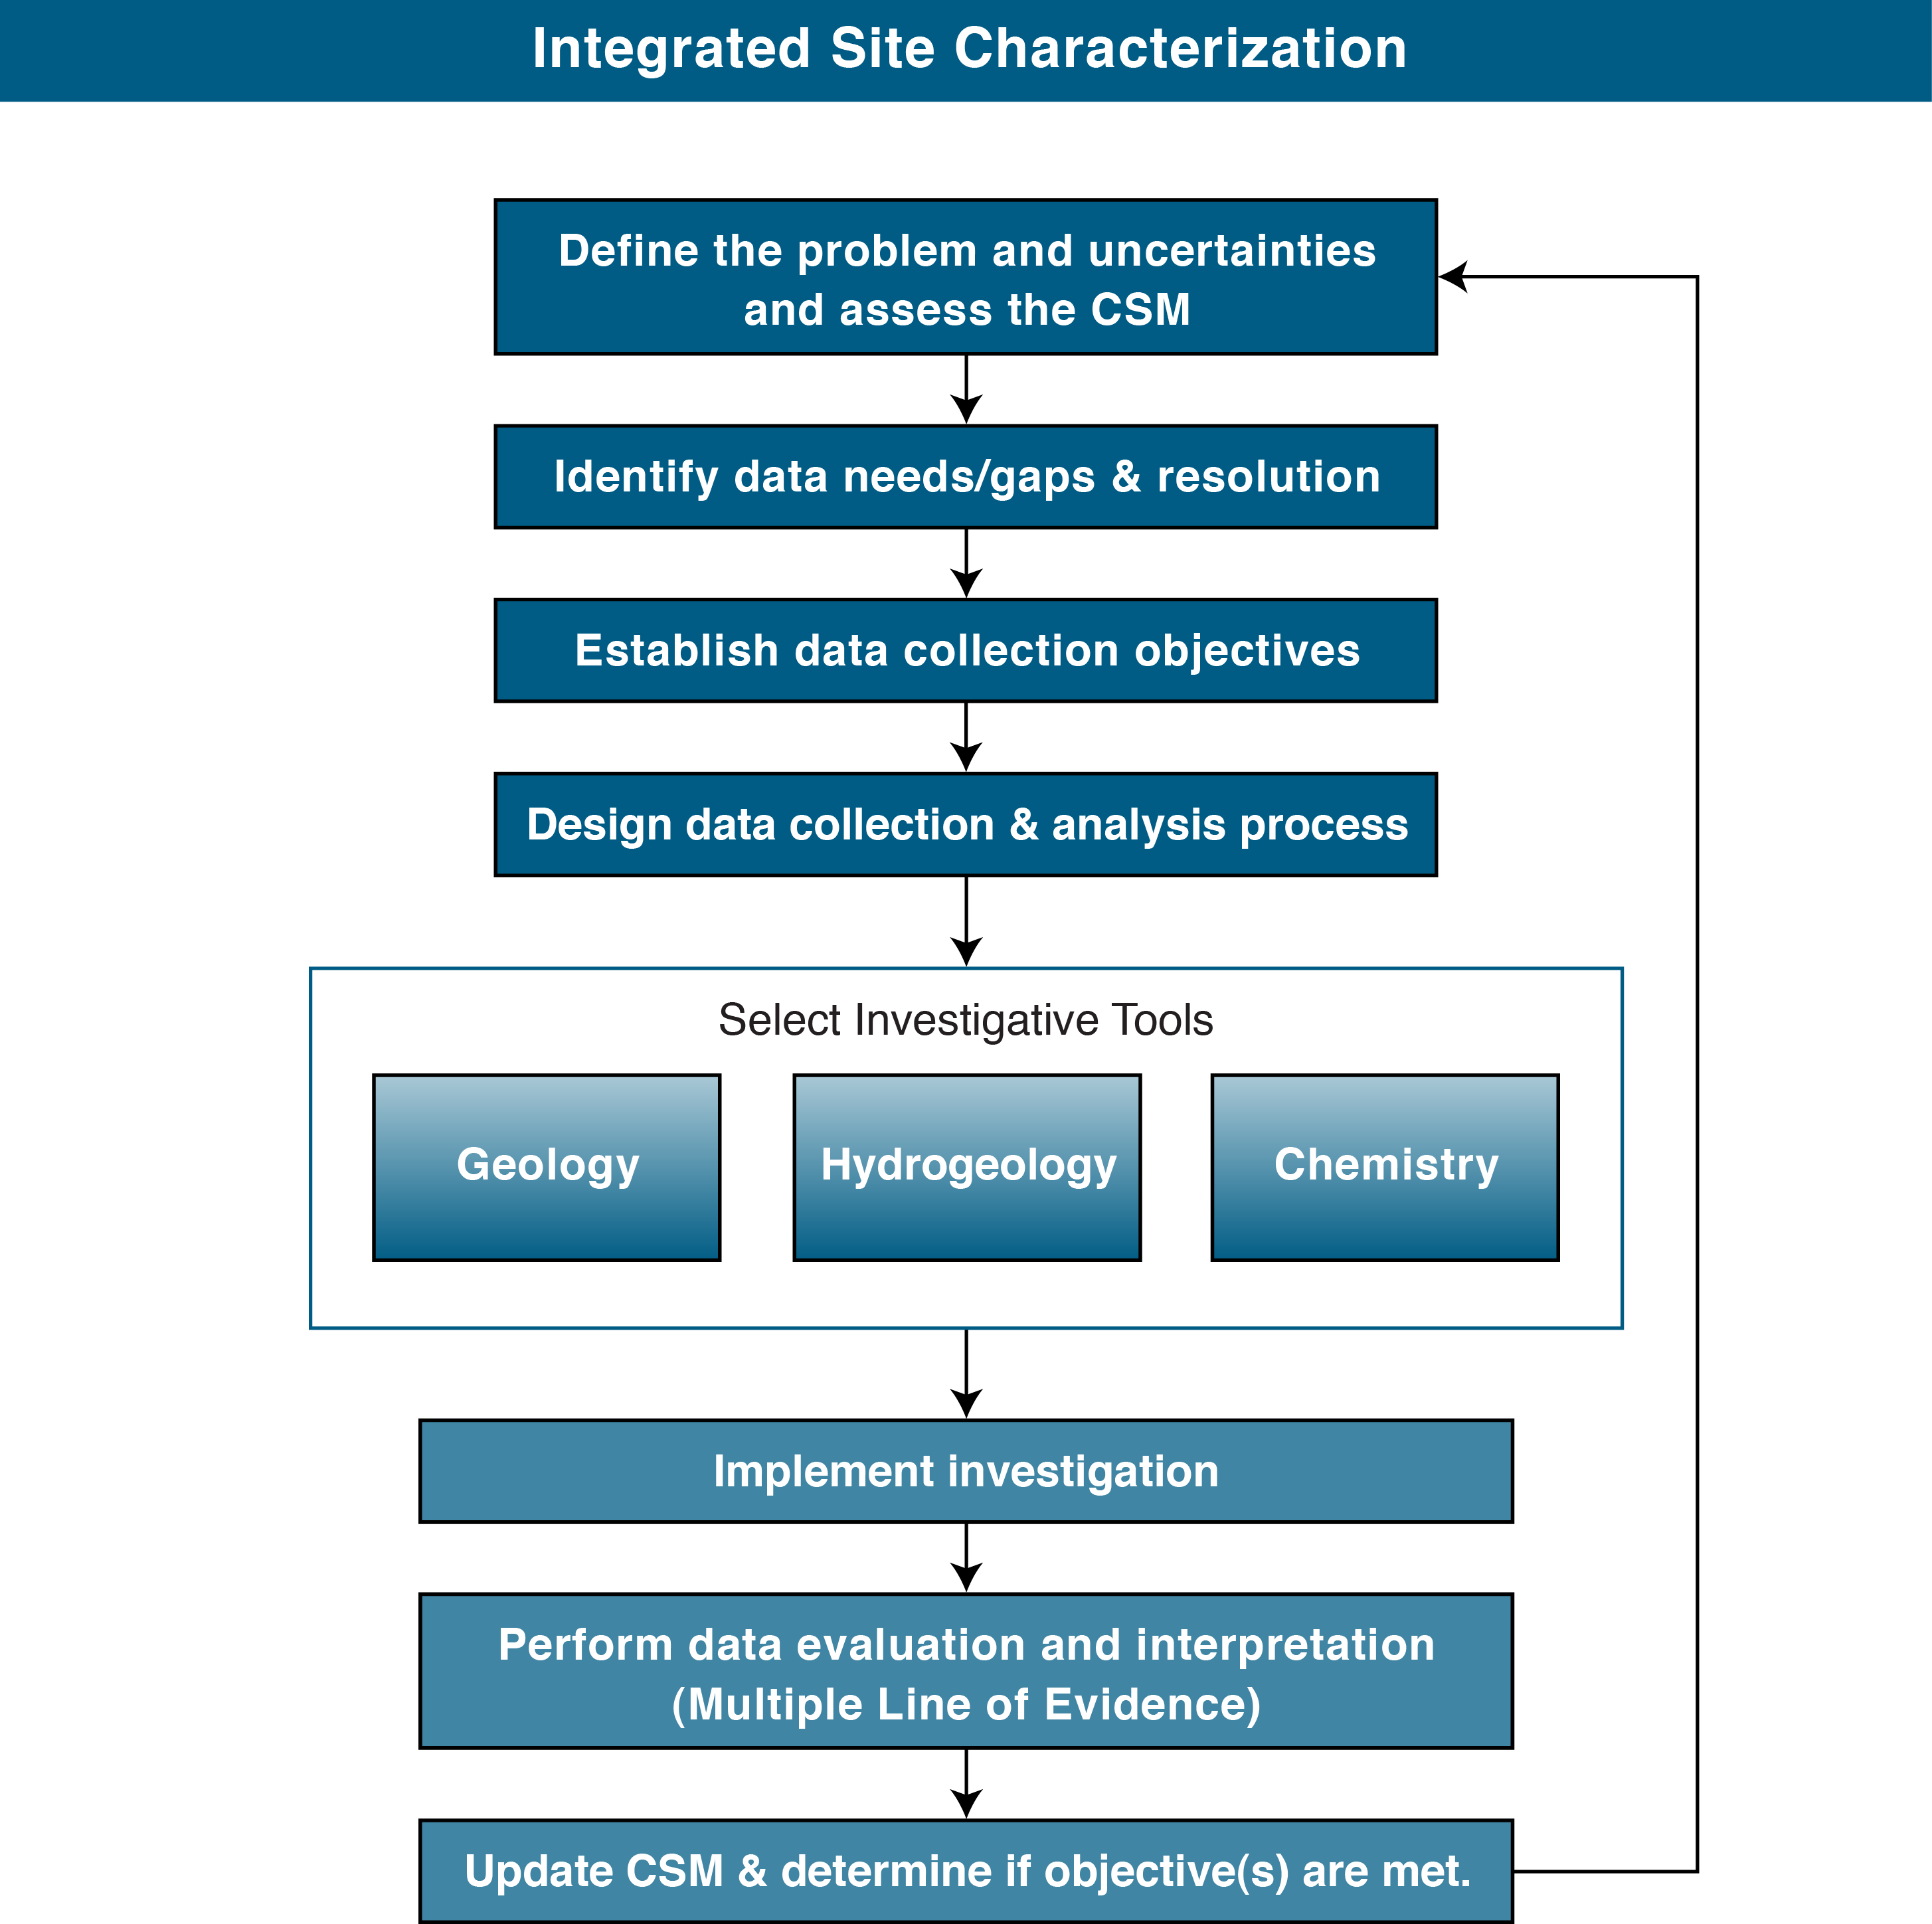
ISC supports iterative refinement of the CSM over the project life cycle with information obtained during site investigation, remedy design, and remedy optimization. Similar to the USEPA's data quality objectives (DQOs), it relies on a systematic objectives-based site characterization process that includes defining the uncertainties and CSM deficiencies; determining the data needs and resolution appropriate for site conditions; establishing clear, effective data collection objectives; and designing a data collection and analysis plan (Figure 4.1 and
ISC is the most effective way to develop CSMs that address groundwater contamination in general and DNAPL in particular. ISC involves eight new concepts based on the current understanding of DNAPL and aqueous-phase plume behavior and the controlling effects of hydrogeologic heterogeneities and matrix diffusion. These new concepts—which represent a substantial reconsideration of the data necessary to develop effective CSMs for DNAPL sites in both unconsolidated and consolidated hydrogeologic settings—are discussed below.
ISC relies on objectives-based data collection, which provides a scientifically defensible foundation for characterization activities and helps define data needs and manage project uncertainty. ISC is a systematic, stepwise process similar to the USEPA’s DQOs, which employ t
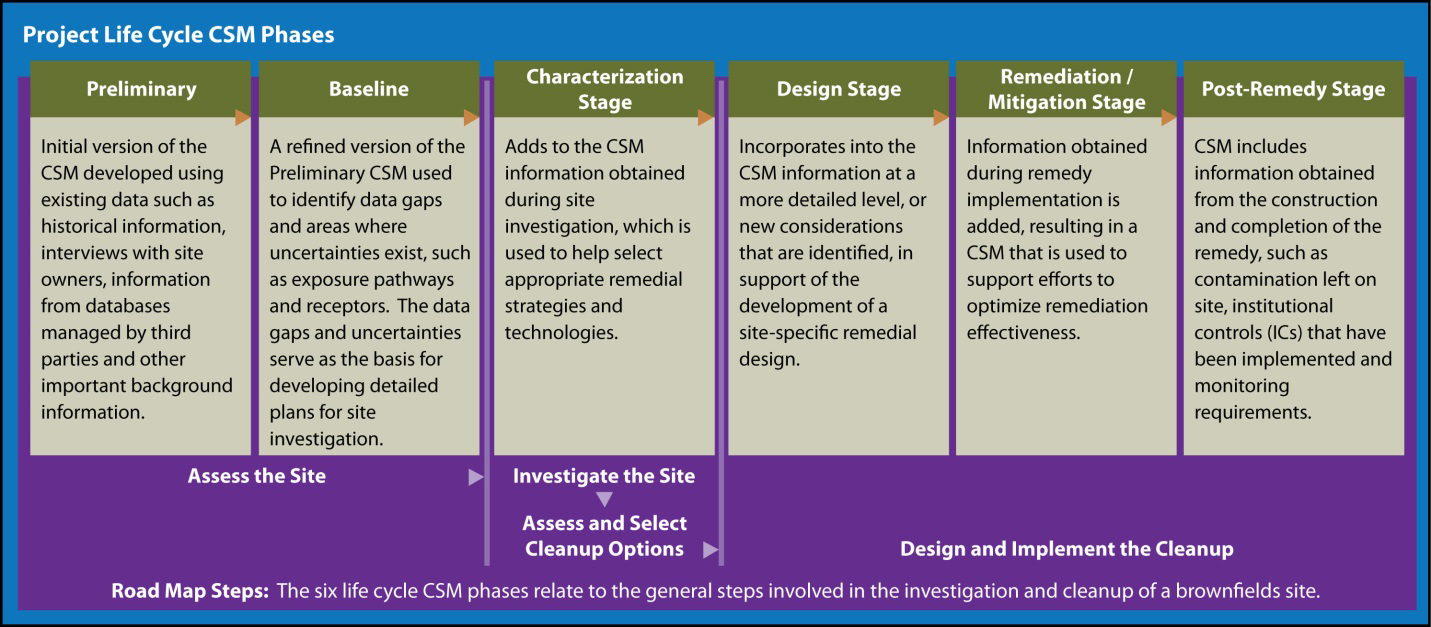
ISC can be applied at any stage—development of the preliminary CSM, baseline characterization, CSM characterization, CSM design, CSM remediation/mitigation, or post-remed
Although not intended as a rigid sequence, Figure 4-1 illustrates the main elements of ISC.
Integrated site characterization.
The following reference materials provide additional information about systematic project planning and the USEPA’s Triad approach:
The goal of DNAPL ISC is to develop a CSM with sufficient depth and clarity to accurately assess risks and develop appropriate remediation strategies. The first step of the ISC approach is to review the current CSM and determine its adequacy against that goal. If a problem becomes apparent, it should be defined in terms of uncertainties/deficiencies with the CSM so that data needs/gaps and resolution can be identified and characterization objective(s) established. An advantage of defining the problem in terms of uncertainties is that it can help determine the cost benefit, or sustainable ROI, of collecting additional data.
The baseline for ISC is any existing site information that helps develop an accurate, representative CSM. Existing data generated using traditional investigation approaches are valuable in formulating a CSM from which to identify initial data needs and gaps; however, the quality of that existing data and the sophistication of that CSM may be less than optimal. Conventional soil and groundwater characterization involved the use of soil borings and monitoring wells to collect relatively coarse subsurface interval sampling (for example, soil samples every 5 feet and groundwater samples from 10 ft screened monitoring wells). At some sites, soil samples were only collected from the unsaturated zone because it was assumed that anything below the groundwater table was best characterized by groundwater samples from monitoring wells. As a result, conventional CSMs were often founded in precise data, yet provided an inaccurate representation of contaminant distribution.
Following are some important considerations when reviewing existing site information and evaluating its usefulness:
This initial review phase should focus on determining what is known about DNAPL use and releases at a site; depending on the available surface and subsurface data, it should describe the heterogeneity due to lateral and vertical lithologic changes, depict the hydrostratigraphic framework from the paleoenvironmental characteristics or the structural features controlling flow, and explain how resolution of existing data affects the reliability and usability of any existing CSM. An initial draft CSM should be created if none exists.
The case study (Appendix B.3) describing Reese Air Force Base in Lubbock, Texas, illustrates a complex pattern of mass flux laterally and vertically downgradient from the source. The aquifer is composed of a very heterogeneous system of interbedded sediments varying from gravels to clays, deposited by alluvial fans and braided streams. The existing monitoring well network was effective at quantifying groundwater concentrations and identifying potential risks, but the long well screens provided limited information on detailed plume structure. The initial phase of the project required reassessment of groundwater concentrations using all available data. This included a sitewide synoptic data set collected using all of the investigation wells (>500 wells) and remediation wells (~50), as well as grab samples from over 100 private irrigation and supply wells within and adjacent to the plume. The revised plume map revealed two significant findings:
Historically, data sets often were smaller and of lower-resolution spatially than those more commonly collected within the past decade. In addition, historical data sets were often limited by higher detection limits than are available today or did not acknowledge the potential for temporal variation in contaminant concentrations. For example, many large sites are monitored on a continuous, rolling basis over periods of months to years, yet interpretations are made from data sets spanning months to years. Further, hydraulic data sets may be based on slug tests that interrogated a relatively small volume of the subsurface. Historical data sets often include higher detection limits that do not adequately characterize the vapor intrusion pathway and are not adequate for decision making during later stages of a project life cycle.
Therefore, historical data may or may not be usable when evaluating a CSM. Comparing the results of historical data with new data requires knowledge of historical data collection and analysis methods. The project team must understand the historical data collection methods, analytical procedures and sampling plans that influence the historical data set, and the usability of those data. Often, historical data sets can be integrated with new, often higher-resolution, data sets when the limitations of the historical data set are acknowledged and incorporated into the updated CSM.
Another case study (Appendix B.2) illustrates the effect of incomplete site characterization on the final CSM. Three dry cleaner sites in Indiana were in the process of remedial action, but uncertainty in the CSMs for each site led to the need for further characterization. The decision to conduct further characterization was based on concerns over vapor intrusion. The three sites are reasonably close together and were assumed to have identical CSMs. Fairly high-density vertical and horizontal soil sampling was conducted at one of the sites, and the results were applied to the sampling plans for the other two sites. When PCE concentration in soil gas could not be explained by the CSM, a dynamic work plan was developed to define the subsurface lithology controlling the aqueous and vapor transport of PCE. Direct-push sampling was conducted, and an on-site lab analyzed the soil gas and groundwater samples. At all three sites, soil PCE source areas, aqueous-phase distribution of PCE, and soil gas (vapor intrusion) pathways were delineated.
The following data should be reviewed: the types of contaminants that were used on site, where they were stored, how they were transported, the waste disposal methods used, and where they may have been unintentionally or intentionally been released to the environment. These data should be used to determine potential releases, release period (dates), release sites, and possible contaminant source zones on site.
Existing data are often ignored or misinterpreted. When existing data are inadequate to determine the vertical lithologic variability, the following questions should be asked:
In Case Example 1 (Appendix B.1), it was established that thermal treatment would be effective on a coal tar DNAPL site if the spatial distribution of the DNAPL were clearly defined within differing geologic units. Required data included the volumes of discrete lithologic logs, porosity, saturation, and properties of the DNAPL. Evaluating the subsurface involved an adaptive management approach with a number of physical and chemical investigative tools and visual methods.
My site has been characterized using conventional techniques. Do I need to redo this work using the higher resolution methods?
If you think your existing site conceptual model is sound and the site management strategy has been successful, an extensive supplemental site characterization program is not needed.
However, if questions remain about key components of the site conceptual model—e.g., hydrogeology; contaminant distribution, fate, and transport properties; and risk—additional characterization using high-resolution techniques can be both beneficial and cost-effective. Some sites may not have been precisely delineated by conventional characterization methods (e.g., soil borings and monitoring wells); in such cases, high-resolution techniques can provide clarity on how to move forward in the site remediation/ management process
The following data should be reviewed: the types of contaminants that were used on site, where they were stored, how they were transported, the waste disposal methods used, and where they may have been unintentionally or intentionally released to the environment. These data should be used to determine potential releases, release period (dates), release sites, and possible contaminant source zones on site.
While groundwater quality data presented on figures are commonly in call-out boxes or shown as isoconcentration contour maps for the primary contaminant(s) of concern (COCs), this approach often results in incomplete interpretation of groundwater quality data. One way to enhance the interpretation of groundwater quality data is to prepare pie charts depicting the chemical signature at each sampling point. A chemical signature is the relative abundance of COCs. When preparing these pie charts, color schemes should take into account the relationship between various compounds. For example, at sites affected by chlorinated solvents, the chlorinated ethenes can be shown using red for PCE, orange for TCE, bright yellow for cis- and trans-1,2-dichloroethene, and pale yellow for vinyl chloride. Similar related color schemes can be assigned to any series of related compounds to enable rapid visual interpretation of chemical signature data on plan-view maps or cross-sectional diagrams.
This approach is critical, as interpretation of chemical concentration data alone is often misleading; groundwater chemistry data collected from monitoring wells represent flow-weighted averages of aquifer conditions in the well vicinity. It is common to find monitoring wells installed along the periphery of a historical source. In such cases, the concentrations of contaminants detected are typically orders of magnitude lower than those present within a short distance of the well screen; however, the chemical signature of those contaminants is typically consistent with a source area or plume core signature (that is, enriched in parent compounds), whereas the chemical signature detected outside of a source area or plume core is often relatively enriched in degradation products. Thus, the use of chemical signature data can enable interpretation of source areas and plume cores that are easily missed when relying on chemical concentration data alone.
In cases where fracture porosity dominates fluid flow and contaminant transport, sufficient data must be acquired to characterize the fractures in terms of spatial orientation, distribution, interconnectivity, and potential for transport or storage of contaminants. Once the strengths and weaknesses and vertical and lateral resolution of the existing site data are understood, hydrogeologic and chemistry data can be integrated to produce an initial CSM and identify data needs/gaps.
Once the uncertainties in the CSM are recognized, specific data needs (for example, type, location, amount, and quality) as well as data resolution (spacing or density) can be described. Spatial resolution should be assessed laterally and vertically. The goal is to achieve a data resolution related to the scale of subsurface heterogeneity that is effectively controlling contaminant transport and distribution. Data resolution should be commensurate with that scale to ensure that the distribution of contaminants is sufficiently delineated and that an effective remedial strategy, if necessary, can be developed.
The necessary resolution may be different for different areas of the site or phases of the project, and depends on the depositional environment (see Appendix A). Collecting system design information may require higher resolution sampling, while determining potential for risk and necessity of remedial action may necessitate a lower vertical resolution to make that determination. One way to cost-effectively achieve the appropriate resolution is to collect collaborative data (see
Determining the correct resolution of data to collect can be difficult. The locations (plan view) and frequency (vertical) of samples are based on the initial understanding of the site prior to deployment. The density of data varies depending on site-specific data collection objectives for each of the data types (geology, hydrogeology, and chemical). For example, if a site has highly varying stratigraphy, more geologic and hydrogeologic data will be required than at a site with less stratigraphic variability.
An effective approach for determining the correct density of data required is to use on-site, real-time analysis coupled with efficient drilling techniques (see Case Example 2, Appendix B.2). Cost-effective tools are available for real-time collection of geology, hydrogeology, and contaminant distribution data; often, direct-push and sonic drilling tools are used. These tools are discussed in detail in Tool Selection Worksheet.
With real-time results, project managers are able to identify subsequent sampling locations based on the evolving CSM (see
It is important to recognize and elucidate the shortcomings of the existing CSM to develop an efficient path forward. A solid understanding of the data collected and work performed at the site to date, coupled with a hydrostratigraphic framework founded on the concepts of facies and depositional environments, provides a clear picture of what is known about the subsurface and a road map for identifying data gaps and developing data collection objectives. This process could involve the following tasks:
Once the data needs (including type and resolution) are identified, specific objectives can be established. Often data collection objectives are vague statements that do not fully describe the intentions and needs of a sampling program—for example, an objective might be to define the lateral and vertical contaminant distribution, and without further specificity, it would be difficult to demonstrate that this objective was met. In this example, the characterization objective should be developed in a way that considers (1) the type of data needed (for example, chemical concentrations); (2) the data density and spatial resolution (for example, lateral and vertical spacing and depth); and (3) the specific concentration endpoints for each contaminant.
The lack of specificity also makes selection of appropriate data collection/investigation tools challenging and could easily lead to misapplication or a recharacterization effort later on. To avoid this, objectives should be continually parsed into increasingly specific sub-objectives, until they are sufficiently succinct and the specific data needs become clear (see Appendix B for examples).
A characterization effort is not a disparate assembly of site data, nor is it an intent, for example, to collect mass discharge data across a site. Assumptions and known conditions about a contaminated site can lead to the selection of specific treatment technologies, both of which have discrete treatment capabilities and costs. To optimize their application, a focused effort to characterize specific parameters of the site may be required. At Well 12A (Appendix B.4), a multicomponent treatment approach was required based on previous characterization data, earlier treatment results, and multiple performance reviews. To do so, a detailed characterization effort was implemented with the following objectives:
The specific data collection objectives included the following:
A three-dimensional model was used to define the source and plume boundaries and to evaluate uncertainty.
ITRC champions the use of SMART remediation objectives for DNAPL sites. Although data collection objectives are not bound to meet all SMART attributes, they should be as specific as possible given what is and is not known about the site. This helps to ensure that characterization activities are driven by clear, focused, specific objectives.
Following are examples of the types of questions that can lead to development of effective data collection objectives depending on site conditions and geologic environment:
Table 4-1 provides examples of effective data collection objectives for DNAPL sites.
|
Data collection and analysis is simply the implementation of the chosen data measurement system and the subsequent organization of the collected data. Three types of data—
The Tool Selection Worksheet describes conventional and new sampling and logging techniques for collecting direct measurements, as well as sensor-based technologies. Because of the complex nature of DNAPL sites, which can involve mass distribution in the NAPL, soil, groundwater, and vapor phases, it is important to start with an approach that is designed to resolve the scale of heterogeneity of contaminant phase(s), concentration, and composition in the unsaturated and saturated zones. By collecting stratigraphic and permeability data at the same time, it is possible to discern the controlling influence that subsurface architecture (permeability and structure) has on mass distribution and interphase mass transfer. The key is to collect data at sufficient frequency, in both the vertical and horizontal directions, to ensure that the mass transport behavior of the system can be classified at a minimum, and characterized explicitly when possible in simpler geological settings, early in the characterization process. Tool selection typically depends on geologic conditions, logistical considerations, and DQOs. For example, at a site contaminated by chlorinated solvents and underlain by stratified sand and silt deposits, one of the following approaches could be used:
Both approaches could produce data sets with resolutions adequate for generating rigorous CSMs; however, the first approach would likely be faster and cheaper than the second approach, although the data would be less quantitative. If the same release occurred at a site underlain by glacial till deposits, the tool selection would likely change. Due to their compact nature and the common presence of cobbles and boulders in glacial tills, use of the MIP might be infeasible, while continuous soil sampling using sonic drilling techniques would remain practical. Depending on the target investigation depths and nature of the till, continuous soil sampling using direct-push drilling techniques might also be feasible, and on-site field contaminant analysis (using a mobile laboratory) of continuous core samples at the desired resolution can provide data sets that produce a rigorous CSM.
Logistical considerations also affect tool selection. Small-scale direct-push drill rigs can be used to access most site settings (for example, inside buildings, in wetlands using temporary roads, in alleyways), whereas larger-scale track-mounted CPT or sonic drill rigs cannot fit in some target investigation areas. Full-scale truck-mounted drill rigs, direct-push rigs, CPT rigs, and sonic drill rigs are further restricted by their size; however, these larger rigs possess greater power and can typically drill to greater depths through more difficult geologic conditions than can the smaller rigs. As the cost of drilling increases (due to more difficult geology and greater depths), the importance of real-time data for cost-effective drilling increases as well. Having a flexible work plan and an on-site laboratory to allow contaminant information to be plotted on maps and cross sections during the investigation helps allow the choice of effective sampling locations and can significantly reduce the overall project drilling budget while ensuring that enough usable data are collected to create a robust CSM.
Data quality objectives also affect tool selection. Using the examples presented above (chlorinated solvent release at a site underlain by stratified sand and silt deposits), if the target detection limit is 1 microgram per liter for PCE, the MIP would not be a viable tool due to sensitivity limitations. In that case, the Waterl
Data limitations should be taken into consideration before tool selection to ensure that the site characterization goals are met with an acceptable level of uncertainty. For example, collecting and evaluating qualitative data prior to quantitative data incorporates the limitations of qualitative data into the data analysis and interpretation process. Consider the following performance characteristics when selecting the tools that best meet the project needs:
By recognizing limits in the selectivity, sensitivity, accuracy, and precision of qualitative data, yet capitalizing on rapid t
When characterizing a site, a substantial volume of data are generated. Many of the tools described in this document generate electronic data that must be managed and interpreted, and this large volume of electronic data provides both opportunities and challenges. The importance of managing data is noted by USEPA (2011a) as: “…the ability to efficiently access and interpret data is essential to guiding project teams through the entire cleanup process, from project planning to site completion.”
Plan for Data Management
It is just as critical to plan how the data will be managed as it is to select the appropriate tools.
A significant challenge in using tools such as the MIP or LIF is that the data they collect are considered qualitative or semi-quantitative and must be integrated, managed, and interpreted along with the quantitative data (for example, contaminant concentrations, hydraulic conductivity). Qualitative and semi-quantitative data frequently have unique quality assurance/quality control measures; they typically are not validated or assigned flags, as may be done for laboratory analytical data. In addition, data from profiling-type tools can represent many individual data points, because they measure parameters at high density (cm to inch scale) with depth and time. All of the above factors can make these data more difficult to manage than data collected solely from point measurements; however, the profiling and logging tools often provide information about contaminant distribution and hydrogeologic architecture that could not be accomplished with conventional point sampling techniques and lab analyses due to budget limitations.
Data from the tools described in this document are typically provided to the consultant or site owner after the end of the field mobilization. In some cases, data can be interpreted in real time to support the field decision-making process. The data format may be digital images or logs, field notes, spreadsheets, or plots of parameters versus depth for logging tools. The data should be archived and transferred into whatever data management tool has been selected for the project. Ideally, the data management tool is capable of handling all of the types of data to be generated as part of the characterization effort. Thus, the data management needs of the project should be considered during tool selection/evaluation. Data management options can range from commercial off-the-shelf database programs to complex three-dimensional visualization software.
When the appropriate data management and visualization tools are used, it is possible to efficiently store, interpret, and present large volumes of electronic data. Higher-end data management tools (for example, visualization software) can provide capabilities for data analysis and communication/presentation. Therefore, just as it is critical to consider the strengths and limitations of each characterization tool in the selection process, it is also important to consider how the data from those tools will be managed and integrated with other data from the site (see Appendix D).
Data collection is generally an expensive process; therefore, it is imperative to glean as much information as possible from the data. As previously stated, three types of data are generally collected: quantitative, semi-quantitative, and qualitative. During DNAPL site characterization, the appropriate data types are collected and the appropriate tools are used to answer questions posed by the following data collection objectives:
Monitoring Wells and Bias
Monitoring wells, as traditionally constructed and used, are not recommended as primary characterization tools in unconsolidated aquifers because of vertical and volumetric averaging of contaminant concentrations associated with this type of sampling. Bias is also introduced in how wells are sampled, because the volume and intensity of sampling further affects the vertical and volumetric averaging, making conclusions based on monitoring wells unreliable.
Use of multilevel devices (for example, packer and port systems or discrete interval direct-push samplers) with hydrologic characterization methods (for example, HPT and EC or CPT logging, multilevel slug tests, hydraulic tomography) and chemical sampling provide an integrated and adequate level of resolution to the characterization process. This level of characterization translates into a more informed selection of the remedy (Einarson 2006; McCall et al. 2006; Dietrich et al. 2008; Kober et al. 2009; Dietrich and Dietz 2012). In addition, packers in the wells avoid concentration averaging and migration of contaminants to new or less-contaminated zones.
This guidance provides an interactive Tool Selection Worksheet that is useful in selecting tools to characterize contaminated sites. The Tool Selection Worksheet offers a rapid method of identifying the appropriate tools and information for collecting geologic, hydrologic, and chemical data. Specific tools and techniques are listed in the following categories within the left column of the Tool Selection Worksheet:
In each type of subsurface terrain, there are physical features that may control the behavior of DNAPL or soluble or gaseous phases of DNAPL contaminants (Chapter 3). Each geologic parameter in the Tool Selection Worksheet helps in understanding the macroscopic and microscopic characteristics of the subsurface that affect the transport of all phases of contaminants (NAPL, dissolved, sorbed, and gaseous). Each geologic parameter informs the physical framework of the CSM that controls the hydrologic characteristics of the subsurface. Analyzing the physical framework of the subsurface against the measured hydrologic properties of flow in the subsurface helps in understanding contaminant migration and distribution and in further refining and verifying the CSM. The geology, hydrology, and chemistry should be evaluated simultaneously and
Figure 4-2 describes the options offered in the downloadable Tool Selection Worksheet from which you can select a suite of characterization tools. Figure 4-2 displays examples on mousing over each box.
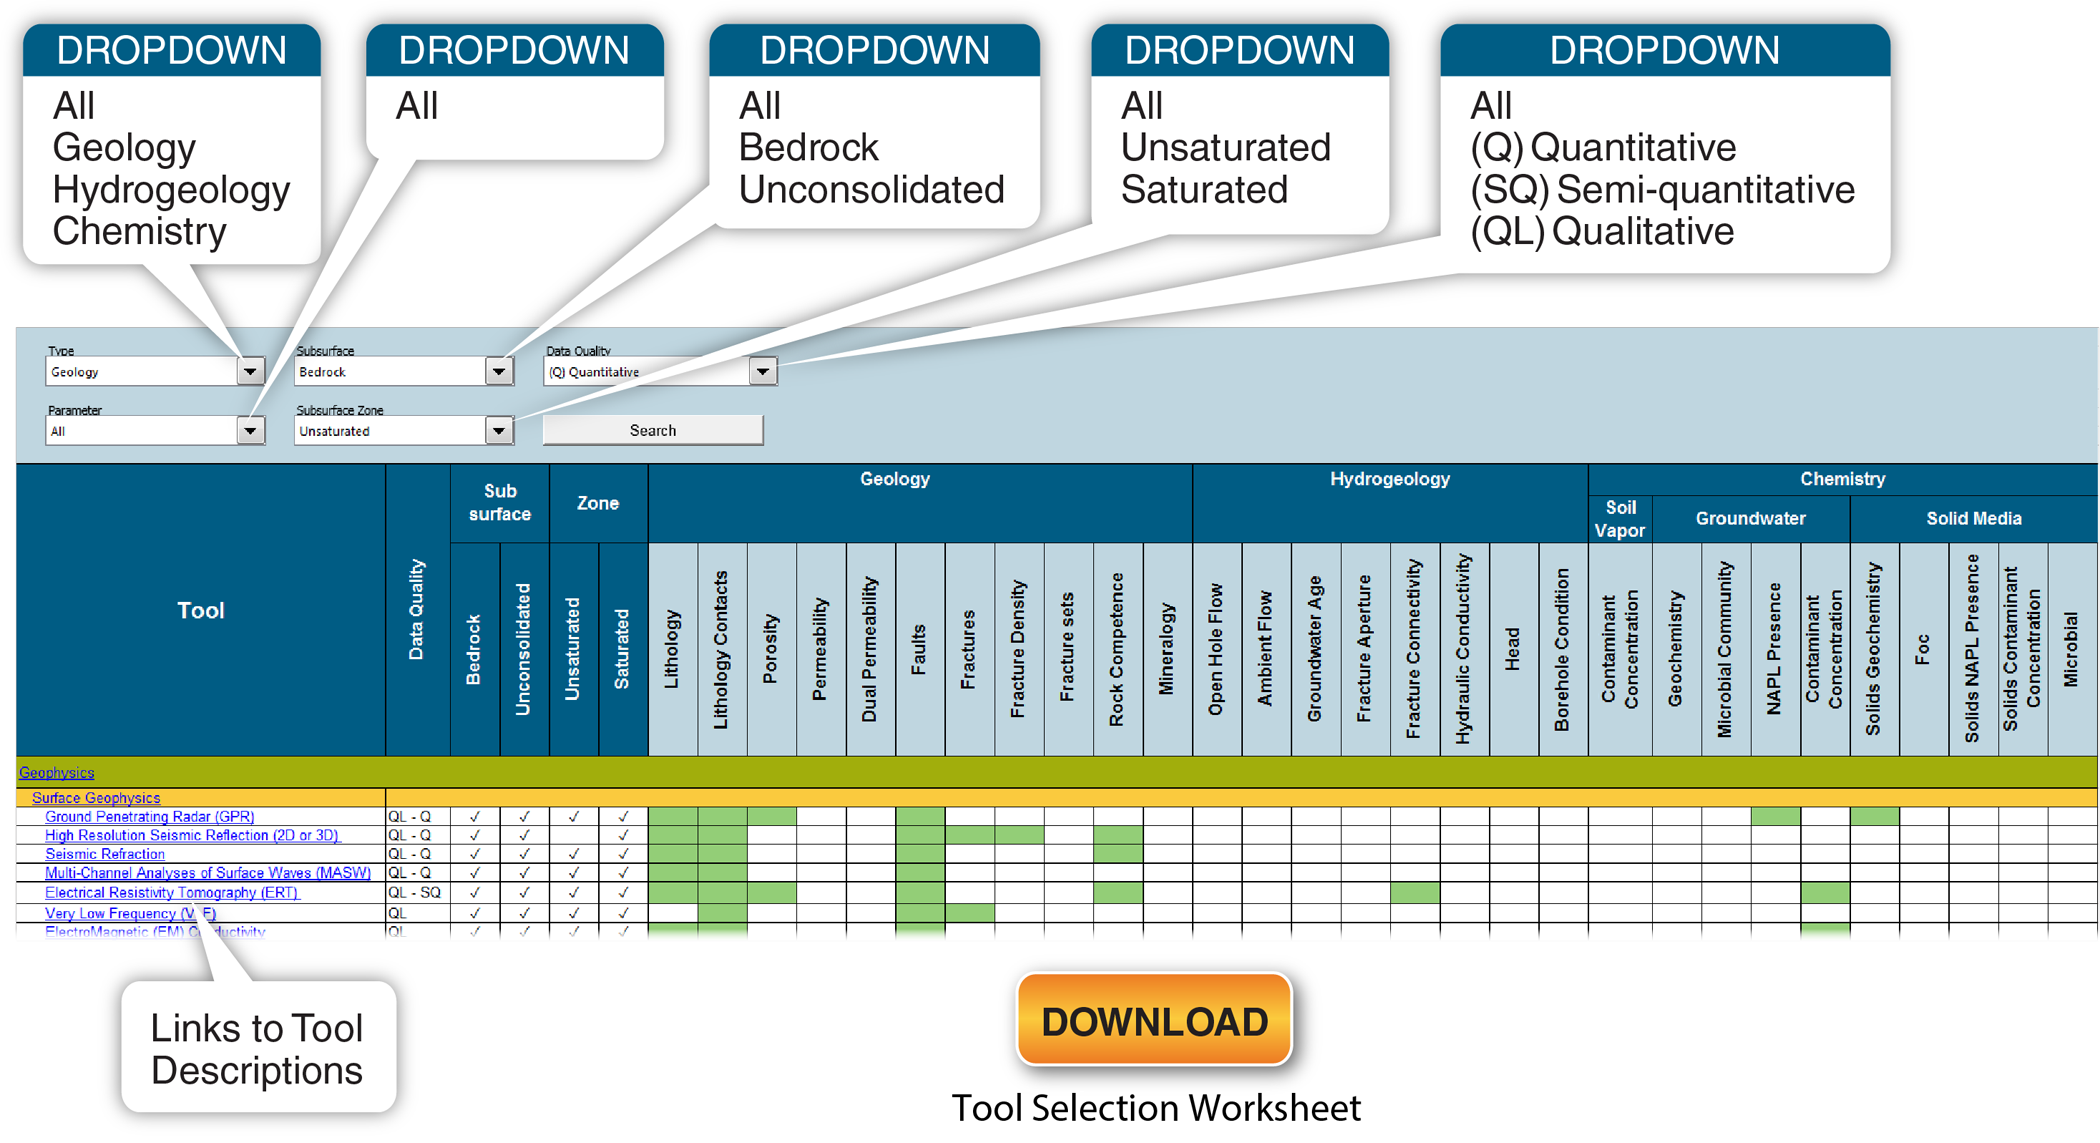
Tool selection framework diagram.
Figure 4-2 contains an image of the header rows of the Tool Selection Worksheet. Within the downloadable Tool Selection Worksheet, dropdown boxes allow you to choose variables in each of four categories: (1) type of investigation; (2) subsurface terrain; (3) parameter or data required; and (4) data quality. Once the selections are completed, a search will populate another sheet with tools capable of collecting the type of data described by the first set of selections. If additional date types are required, another set of variable can be selected and an additional search can be completed and added to the sheet containing the first search. The search variables for both searches are listed at the top center.
Clicking on a specific parameter, for instance lithology, links to a description of the parameter and why it should be collected during characterization of the geology in a CSM. These descriptions are available for all parameters.
In the Tool Selection Worksheet, each tool name links to more information on the tool. Descriptions of the tool, applicability of the tool, its advantages and limitation, its data quality capability, and difficulties that may be encountered when using the tool are included. Additional information is contained in the references provided at the end of each technology description table. These are linked to the full reference information.
Many of the tools are capable of collecting data in all subsurface conditions; however, some are more limited. For example, some tools cannot be used in screened or cased holes or in unsaturated conditions, and others may be able to penetrate relatively shallow depths in unconsolidated material but cannot penetrate bedrock subsurfaces without a borehole.
The downloadable Tool Selection Worksheet illustrates the applicability of each tool by shading the cell that corresponds to the tool (leftmost column) with the parameter (uppermost columns). For example, ground penetrating radar (GPR) can be used to identify lithology, lithologic contacts, and faults. The data obtained by a GPR survey can be qualitative, semi-quantitative or quantitative depending on the care taken in calibrating the tool responses to specific geologic conditions. The Tool Selection Worksheet contains 97 tools and techniques that can be used to collect and analyze site parameters.
Having established the data needs of the DNAPL site investigation, the shaded cells of applicable tools help in selecting a suite of tools capable of collecting data to assess the site parameters in the data collection objectives. For instance, Appendix B, Case E
Quantitative = Q , tool that provides compound-specific values in units of concentration based on traceable standards (such as μg/L, ppm, or ppbv)
Semi-quantitative = SQ, tool that provides compound-specific quantitative measurements based on traceable standards but in units other than concentrations (such as ng or µg) or provides measurements within a range
Qualitative = QL, tool that provides an indirect measurement (for example, LIF and PID measurements provide a relative measure of absence or presence, but are not suitable as stand-alone tools for making remedy decisions)
The links to the Tools Descriptions (Appendix D) must be reviewed to assess the best tools for a particular site situation. References make research of specific tools easier and much quicker as a number of the tools, originally classified as applicable, can be eliminated due to site conditions, access, cost, availability, deployment challenges, or DQOs. As discussed earlier, this Tool Selection Worksheet does not select individual tools, but it does allow for the elimination of many tools depending on the data needs and investigation plan.
The data quality determination is not tool specific. Many tools can collect semi-quantitative data as well as quantitative data if care is taken to calibrate the tools with the subsurface and collect and analyze the data carefully. Many of the downhole geophysical tools have the capability to collect qualitative as well as quantitative data depending on the requirements of the investigation. Depending on the DQO, availability, accessibility, and cost, the final selection of tools may not be appropriate and alternative tools must be considered. Regardless, an adequate investigation requires that the characterization objective be met. There is no need to collect less or more data than necessary; however, the data collected must fill the data gap in the CSM.
The objective of evaluation and interpretation of site characterization data is to gain a clear understanding of past, present, and potential future environmental conditions at a site. Through the context of the CSM, data evaluation and interpretation can facilitate more informed remedial decisions for the site. Thus, only through data analysis and interpretation can the project team make decisions (for example, characterization efforts answer a stated characterization objective, or an assumption about the conditions of the subsurface are not supported by the data, and the original assumptions must be revisited). Specifically, the data should reduce the levels of uncertainty in the CSM, with respect to the data collection objectives at the site, to an acceptable level. Through integration of all of the data types (geologic, hydrologic, and chemical), collaborative data sets (USEPA 2010) can be generated. This multiple-lines-of-evidence approach enables the CSM to provide a clearer description of contaminant transport, storage, and attenuation.
Typical approaches to evaluating geologic data include preparation of cross sections, fence diagrams, or three-dimensional representations across a site. Contour maps of relevant geologic surface elevations (isopach maps) are also helpful for many sites. When evaluating the geology, consider answering the following questions:
Special considerations in the evaluation and interpretation of the geologic data are as follows:
Hydrogeologic data support calculation of average linear groundwater velocity, groundwater volumetric flow, chemical travel time, mass flux, and mass discharge. These site-specific determinations must fit into the regional geologic setting to validate the hydraulic conditions against the physical factors in the subsurface. Examples of hydrogeologic characteristics relevant to a DNAPL site investigation include the following:
Groundwater elevation gradients may not be a reliable indicator of flow direction- The groundwater elevation gradient for an aquifer expresses the gravitational driving force supporting groundwater flow, but it is not the only determinant of groundwater flow direction. The hydraulic conductivity structures of heterogeneous, anisotropic aquifers are often not aligned with the fall line of the groundwater elevation gradient. In these cases, relatively small hydraulic conductivity contrasts can direct groundwater flow and contaminants in directions significantly off the elevation fall line” (Payne et al. 2008).
Special considerations in the evaluation and interpretation of the hydrogeologic data are as follows:
Evaluation of groundwater elevation data. Groundwater elevation data are often used to estimate groundwater flow direction and groundwater flow velocities (when coupled with geologic properties and hydraulic conductivity data). The use of groundwater elevation data alone, however, without incorporation of geologic structure and the spatial distribution of hydraulic conductivity, does not reliably predict groundwater flow direction, especially at small-length scales that are increasingly relevant to DNAPL remediation activities. Groundwater elevations typically vary seasonally; therefore, it may not be possible to predict long-term groundwater flow patterns based on only a few monitoring events.
Groundwater elevations also vary in response to significant precipitation or drought events, local and regional pumping, as a result of remedial activities, or changes in site conditions such as the extent of paved surfaces. The CSM should consider variations in groundwater elevation over time and the potential for these variations to influence the mass fluxes into and out of the groundwater system. Estimates of the apparent groundwater flow velocity from groundwater elevation and estimates of hydraulic conductivity are prone to error due to the inherent inaccuracy of hydraulic conductivity estimates (+/-50%) and variations in the ratio of the effective to total porosity (+/-50%) spatially within and between stratigraphic units.
A variety of analyses may be conducted using chemical data collected during investigation of a DNAPL site:
Special considerations in the evaluation and interpretation of the chemical data are discussed below.
It is uncommon to conduct tracer tests at sites, unless they are in karst terrains; however, due to the historical use of multiple chemicals at different times and in different portions of sites, trace contaminants present can often be used to interpret the locations of distinct source areas and plumes. When evaluating trace contaminants, it is important to include both parent and daughter products. A simple approach for identifying potential trace contaminants is to arrange chemicals in data tables with respect to their parent-daughter relationships. Related compounds in certain wells are easily observed. Once trace contaminants have been identified, the sum of related compounds (that is, parent and associated daughter compounds) can be plotted on plan-view maps or cross-sectional diagrams. It is possible to use tracer data to differentiate among the footprints of multiple distinct plumes that are dominated by a single primary contaminant (for example, TCE).
For example, mapping geochemical parameters such as total dissolved solids and chloride can serve as chemical tracers. Reductive dechlorination could produce an increase in chloride concentration relative to background, which can be detectable in advance of the migrating dissolved-phase plume. Because the chloride increase does not represent a drinking water criterion exceedance, it has often not been considered relevant and thus not used as a means to further investigate an aquifer; however, it can be an early sign of the presence of DNAPL, and can point toward the location of an early plume migration at depth. If vertical aquifer sampling data show increases in chloride at select depth zones, this may well indicate a pooled source of DNAPL upgradient. Therefore, chloride increases should be considered when mapping in three dimensions, and as a part of the CSM. At the very least, increased chloride concentrations can identify the preferential contaminant flow paths that are important to the CSM even if the source is a site-specific activity that released chloride not associated with dechlorination. Further geochemical analyses may help delineate the two sources.
Deuterium, oxygen-18, and carbon-13 isotopes provide qualitative information on the origin of water and can be used to infer age. Radioactive isotopes can infer age by determining the rate of decay of a radioactive isotope. Common isotopes include hydrogen, (tritium) carbon-14, and chlorine. These may be useful in indirectly estimating bimodality in water sources, and could be an indication of dual permeability and fracture connectivity (Harte 2013b; Cook and Böhlke 2000; Coplen, Herczeg, and Barnes 2000).
The age of the groundwater can indicate whether it is from an ancient, potentially subsurface source or whether the aquifer is being replenished with modern water from the surface. If an aquifer is being replenished with modern water, the aquifer water is vulnerable to contamination encountered while infiltrating from above. With careful testing, the flow regime can be clarified according to the chemical age of the water. Examined along a flow path, for instance, if the age increases rapidly from one sampling point to another, movement between the two sampling locations is slow.
The overall goal of an ISC is to collect the data necessary to provide an updated, site-specific, three-dimensional CSM, sufficiently detailed at the relevant scale, to effectively and efficiently guide site environmental management. The process of developing and updating the CSM includes compiling and synthesizing existing information, identifying data gaps and uncertainties, and determining subsequent data needs. As described in Chapter 1, oversimplified characterization of subsurface conditions has led to the concept of engineering around geology; however, remedy performance track records have shown that concept to often be flawed.
The focus of a CSM may shift from characterization toward remedial technology evaluation and selection, and later, remedy optimization. Throughout the extent of a project, decisions, data needs, and personnel shift to meet the needs of particular project stages and the associated technical requirements. Continuing to refine the CSM as the project progresses requires the ongoing collection of an adequate amount of qualitative data. In the latter stages of a CSM, additional data collection is often driven by the goal of answering specific questions or reducing uncertainty of highly specific components. At all points in the CSM life cycle, the CSM is simply a hypothesis of site conditions and processes, and therefore additional quantitative data collection should continue to test the hypothesis at the appropriate levels.
For example, a CSM may indicate that most of the contaminant mass migration is occurring in one of many laterally extensive sand stringers within a large low-permeability silt and clay layer. The characterization objective for additional work would then be to measure the contaminant flux through the sand stringers, and this could be accomplished through a number of the tools presented in the Tool Selection Worksheet. In this simple example, the result is essentially binary, asking the question: “is the migration through a single stringer? The CSM may require updating based on the results and additional investigation/evaluation undertaken as needed.
A CSM is rarely composed of individual elements with weak reliance on each other. The examination of how additional quantitative information can have a material effect on the CSM as a whole, and on other individual elements, should be central to the updating process. The integration of new data into old concepts requires experienced practitioners, particularly as detailed site investigations in the middle stages of the CSM life cycle can often have far-reaching effects not readily apparent simply from the gathered data.
Source: USEPA 2015
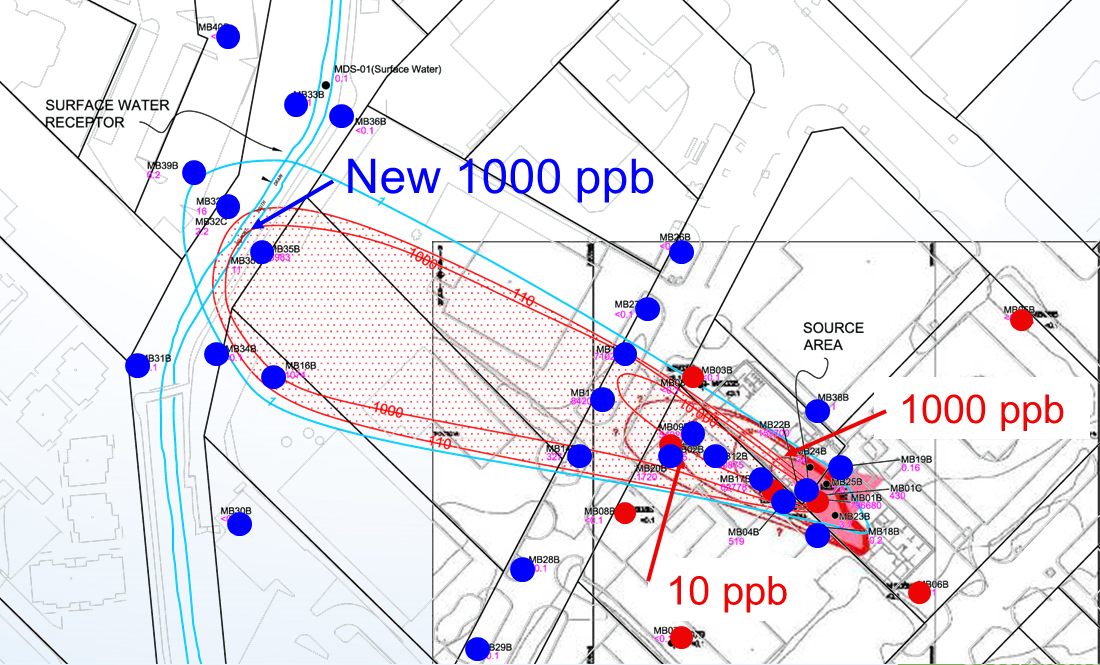
Scenario. Tetrabromoethane (
Uncertainties. Monitoring wells were originally installed with long-screened intervals (~ 10 meters). This screen length was not likely to identify geologic controls on the plume. As a result, surface water receptors could have continued to be at risk.
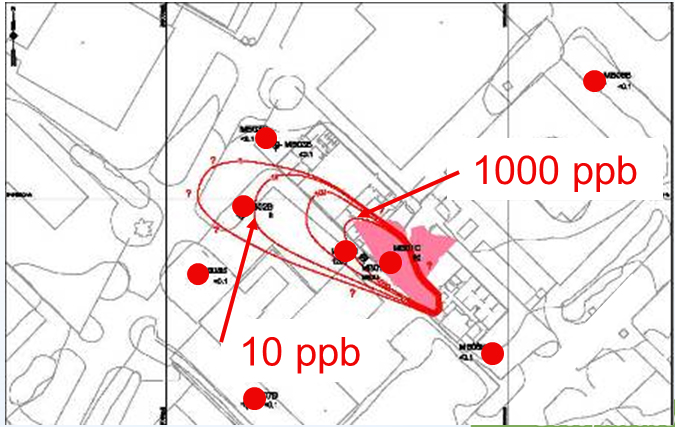
Original plume interpretation (red points are monitoring wells).
New data. An extensive drilling and sampling event was undertaken using sonic technologies and detailed core analysis followed by MIP for high precision placement of 1 meter well screens. Surface water sampling was also implemented.
Effects on the CSM. Additional sampling and new data identified a larger plume than recognized from historical data. The plume is now expected to reach a surface water receptor (Figure 4-5). There is a need to understand the discharge dynamics between groundwater and surface water as contaminants are not seen in surface water at levels predicted by a mixing model.
Scenario. PBA has been released from a mineral processing facility into layered silt/sand/gravel stratigraphy (same site as in previous example). The plume is primarily contained in two high-permeability sand/gravel layers within silty formation. No detectable concentrations were found below a lower clay aquitard, and DNAPL is suspected to be present in sand layers and in preferential pathways through silty layers.
Plume following additional delineation (blue wells = second delineation; red wells = initial delineation).
Uncertainties. Neither the location of most of the DNAPL mass nor the amount of total DNAPL mass in the subsurface are known. DNAPL PBA is very dense (SG = 2.97) and is thought to have minimal lateral migration following release. The highest dissolved concentrations are in the sand/gravel layer immediately above the clay aquitard, and it is not known if DNAPL has pooled there.
New Data. Passive flux meters were deployed in a downgradient transect. The source zone is located inside a very low overhead building, and it is determined that CPT-based tools are not viable. A mini-sonic rig is used to install very-high-resolution monitoring wells (4 inch screens). A partitioning interwell tracer test (PITT) is also conducted.
Effects on the CSM. Most of the contaminant flux is through upper sand and silt layers. In addition, most groundwater flux is through a lower sand layer (Figure 4-6). The implication is that there is little DNAPL in the lower sand layer in the original source area. Figu
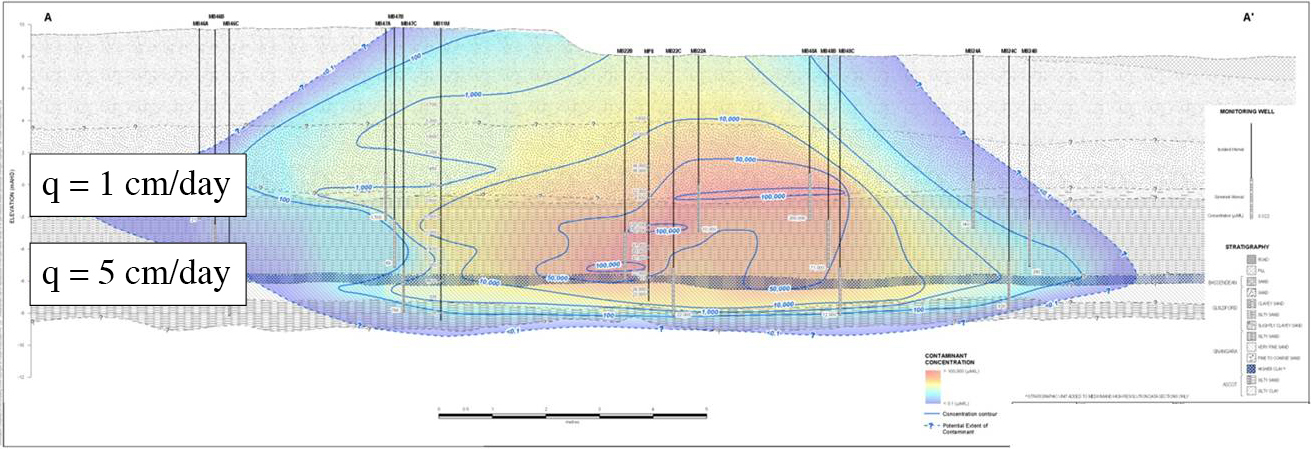
Tribromoethene flux downgradient from the source.
Source: Johnston et al. 2013.
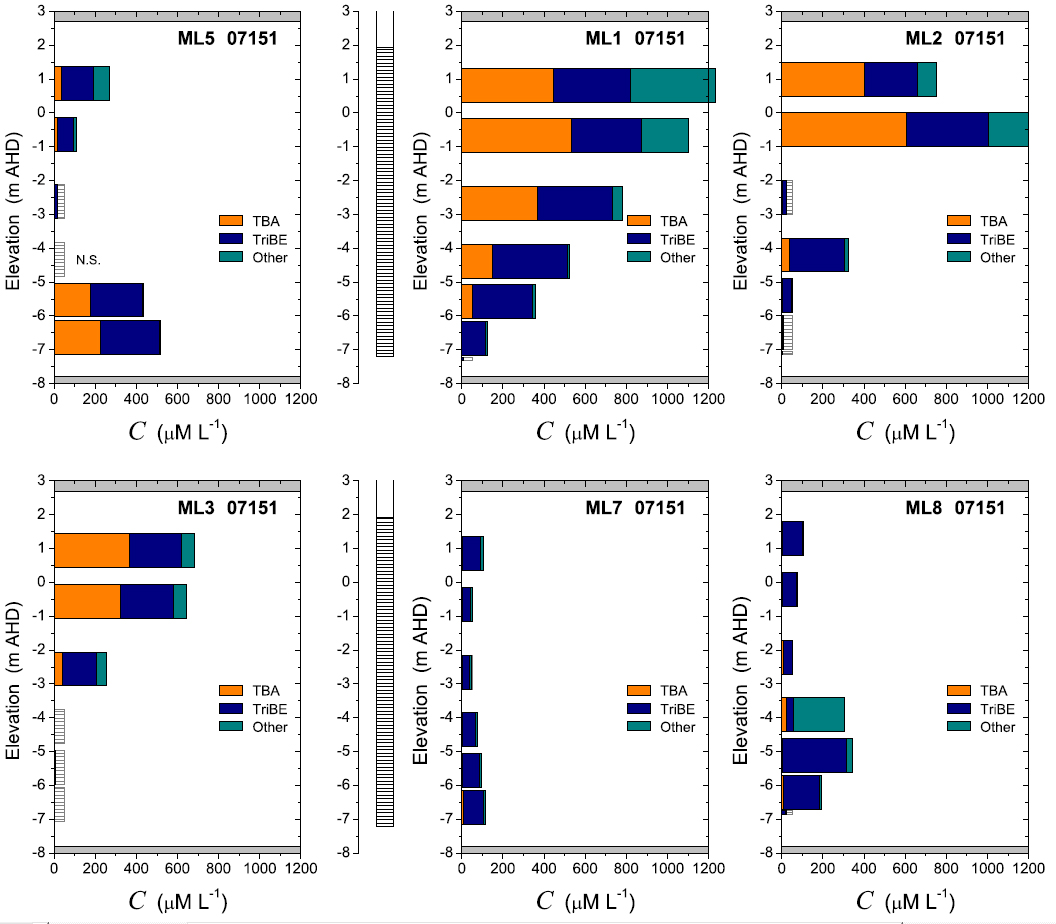
Distribution of brominated compounds in source zone from multi-level monitoring wells
Source: Johnston et al. 2013.
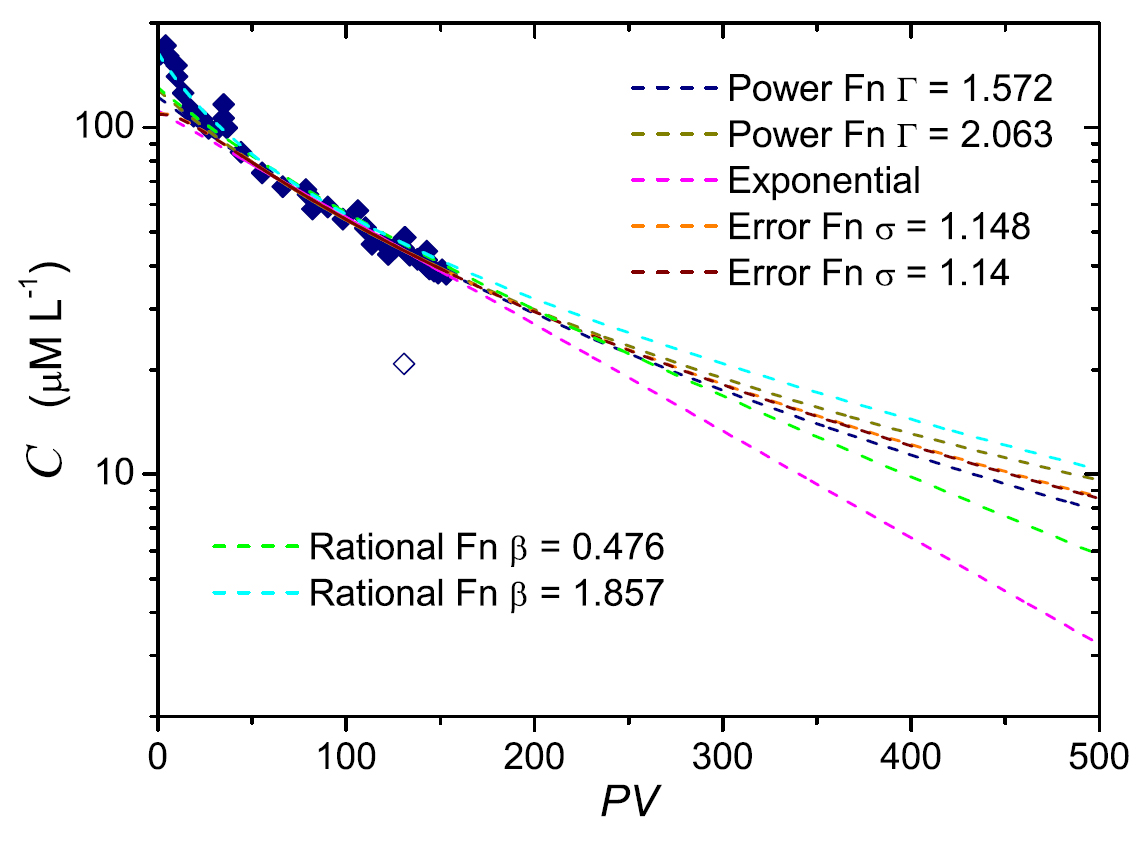
Scenario. PBA has been released from a mineral processing facility into a layered silt/sand/gravel stratigraphy (same site as in previous examples). Most of the DNAPL mass is present in the upper regions of the source zone. Low DNAPL mass estimates (from PITT – not discussed) pointed to slow source zone pumping as the remedial approach (Figure 4-8).
Uncertainties. The mass estimate was arrived at through a number of different lines of evidence; however, uncertainty resulted in an estimated lifespan for source zone DNAPL of 3–20 years.
New Data. Detailed monitoring during pilot pumping (from multilevel wells as in the previous example, and from a single centralized extraction well) was used to calibrate source depletion models (Figure 4-9).
Effects on the CSM. It was determined that flow channeling may lead to extended remediation times under a pure pumping approach. The DNAPL mass estimate was increased from 220 kg to 258–295 kg.
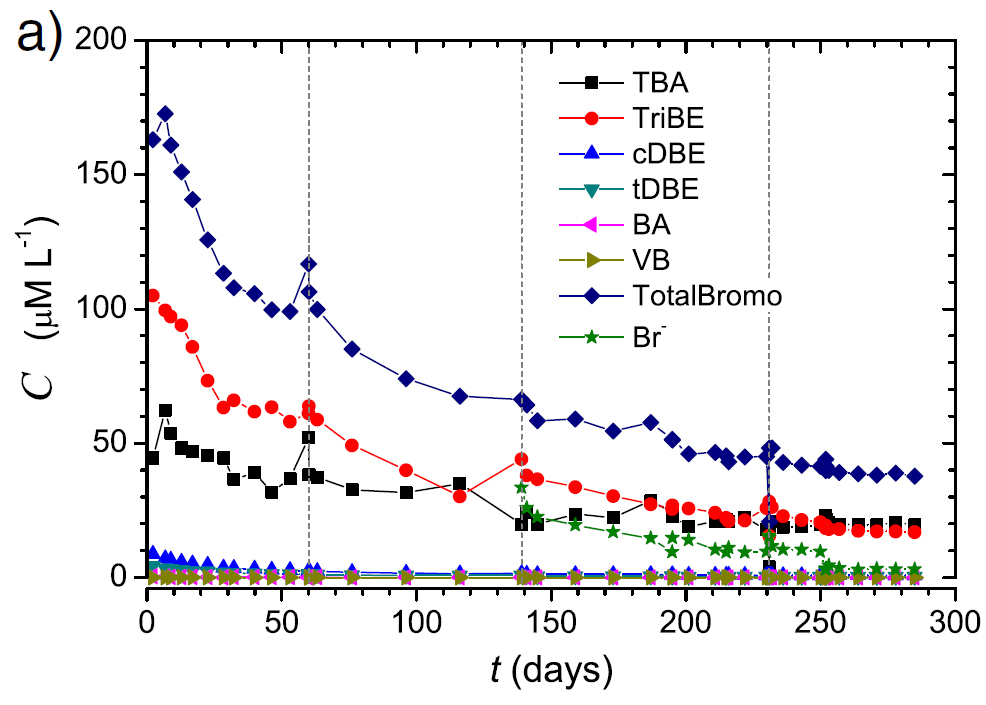
Concentration decrease in source zone under remediation pumping conditions.
Source: Johnston et al. 2013.
Predictions of various depletion models in source zone under remediation pumping conditions.
Source: Johnston et al. 2013.
Characterization data are commonly interpreted through the use of visual representations and analytical and numerical models. Visual representations may be two- or three-dimensional representations, usually combining one or more types of characterization data to provide an increased understanding of contaminant distribution and behavior. Whichever interpretive tool is used, the results are only as accurate as the data used to prepare them and the skill of the modeler.
Visual representations integrate different types of characterization data in a meaningful way, which can facilitate communication of complex geologic, hydrologic, and chemical concepts to both technical and nontechnical audiences (see USEPA training, “Use of Geostatistical 3-D Data Visualization/Analysis in Superfund Remedial Action investigations”). These visual representations range from simple two-dimensional cross section with lithologic layers and groundwater elevations models to web-based dynamic geospatial-based three-dimensional models incorporating hydrological conditions and contaminant mass flux information (see example of an environmental visualization of DNAPL migration into a regional aquifer from a drum disposal area).
Although many public domain/freeware packages are available, they may be limited in types of data that can be analyzed, extent of visualization, quality of graphics, graphic output format options, and breadth of statistical analyses. Commercial packages vary widely in price, features, and technical support services. Data interpolation algorithms also vary considerably, and the same data set could be rendered differently by different software packages.
Visualization software may include some or all of the following features:
The evaluation of high-resolution data sets and the integration of newly developed data with lower-resolution legacy site data is particulary challenging. The use of statistical data evaluation tools to interpret data requires a high-resolution data set in both the vertical and horizontal dimensions. Many tools develop high-resolution vertical data sets, but it is not always cost effective to generate high-resolution horizontal data sets. Plumes are rarely characterized using a grid approach; more commonly, a transect approach is used. When using transects to characterize sites, it is possible to accurately interpret data within a single transect, but often it is not possible to interpolate data between transects with a high degree of accuracy.
The use of statistical data evaluation tools to interpret data may be considered a relatively objective means of interpreting site data; however, it is possible to adjust the manner in which the data are interpreted and presented. To do so in a defensible fashion requires some knowledge of geostatistics. Alternatively, a statistical tool can be used to develop a visually appealing rendering of site data that may not be statistically justified, but that is consistent with a subjective interpretation of a collaborative data set from the site.
Collaborative data sets are generated when multiple tools are used at a single site. This is commonly the case when both historical and newly generated data are used to develop a rigorous CSM. Collaborative data sets are also developed at sites where a variety of tools are used (for example, a combination of qualitative screening tools and quantitative confirmation tools). In such cases, it may not be possible to use statistical data evaluation tools to support data interpretation or visualization, and it may be necessary to subjectively interpret the various types of data and present them in plan or cross-sectional views using traditional data presentation tools (for example, CAD or GIS).
Various analytical and numerical models are available to help interpret data (past and present) to refine a CSM. Analytical models can range from simple equations to more complex equations that are evaluated using spreadsheet tools, and they can be used by a wide range of practitioners. Numerical models are typically used by practitioners with a more specialized background and generally involve more sophisticated input data sets.
Analytical and numerical models provide a simplified representation of complex conditions that occur in the field. While uncertainty is involved with applications of these models, tangible benefits can be gained by using these tools, such as an enhanced understanding of physical and chemical conditions in the subsurface, range of remediation time frames that can be expected, and range of behaviors to expect during or after implementation of a remediation system.
Analytical or numerical models can be used to estimate the following areas of analysis:
SourceDK is a planning-level screening model for estimating groundwater remediation time frames and the uncertainties associated with the estimated time frame (Farhat et al. 2012). In this document, remediation time frame is the time required for the high-concentration source zones at a site to reach a certain target concentration. It is public-domain software developed for the Air Force Center for Engineering and the Environment by GSI Environmental, Inc. (GSI). SourceDK consists of three tiers, as discussed below.
REMChlor (Remediation Evaluation Model for Chlorinated Solvents) is a contaminant source model based on a power function relationship between source mass and source discharge, and it can consider partial source remediation at any time after the initial release. The source model serves as a time-dependent mass flux boundary condition to the analytical plume model, where flow is assumed to be one-dimensional. The plume model simulates first-order sequential decay and production of several species. The decay rates and parent-daughter yield coefficients are variable functions of time and distance. This approach allows for flexible simulation of enhanced plume degradation that may be temporary in time and limited in space, and which may have different effects on different contaminant species in the decay chain. Cancer risks posed by carcinogenic species in the plume are calculated assuming that the contaminated water is used in a house for drinking, bathing, and other household uses.
PREMChlor is a probabilistic version of the REMChlor model. DNAPL site characterization data can be used to develop a potential glide path for either monitored natural attenuation or for remediation projects that can be compared against future DNAPL site characterization data. Sites where the future data compare well against the glide path have adequate CSMs, while sites where the future data deviate against the glide path may need review and adjustment of the current CSM.
The BIOBALANCE Toolkit is a mass-balance-based modeling/data analysis system that allows the user to perform the following tasks:
BIOBALANCE can help DNAPL site managers better interpret and understand their DNAPL site characterization data using one or more of the following modules: Source Module, Competition Module, Donor Module, and Plume Module.
The Monitoring and Remediation Optimization System (MAROS) methodology allows users to apply statistical techniques to existing site characterization data to suggest if and where improvements to current monitoring system are needed. These improvements include changes to the monitoring frequency, parameters evaluated, and the number and location of groundwater monitoring wells. The software uses both statistical plume analyses (parametric and nonparametric trend analysis) developed by GSI, and allows users to enter external plume information (empirical or modeling results) for the site. These analyses allow recommendations on future sampling frequency, location, and density to optimize the current site monitoring network while maintaining adequate delineation of the plume as well as knowledge of the plume state over time to meet future site-specific compliance monitoring goals.
Recently, there has been increased emphasis on the use of mass flux and mass discharge concepts for DNAPL site characterization (ITRC 2010, ITRC 2011b). The Mass Flux Toolkit is an easy-to-use, free software tool that compares different mass flux/mass discharge approaches, calculates mass discharge from transect data, and applies mass discharge to manage groundwater plumes. The Mass Flux Toolkit allows users to calculate the mass discharge across one or more transects of a plume and plot mass discharge versus distance to show the effect of remediation and effect of natural attenuation processes. Three types of uncertainty analysis are included: uncertainty range due to interpolation; uncertainty due to the variability in the input data using a Monte Carlo-like analysis; and an uncertainty analysis that shows the dependency of the mass discharge estimate on data from each monitoring point.
The Matrix Diffusion Toolkit is a
The Matrix Diffusion Toolkit is a valuable resource for the development of CSMs, supporting site characterization efforts, planning remedial designs, and determining if matrix diffusion will affect remediation goals for contaminated groundwater sites. The software can assist site personnel in updating or creating a more accurate CSM, which will enable them to determine whether matrix diffusion processes are significant enough to cause rebounding groundwater concentrations of downgradient plume concentrations above remediation goals after plume remediation or isolation is complete. Having this information available before a remedy is implemented can assist site decision makers in selecting more appropriate remedies and effectively and efficiently addressing the potential issues of matrix diffusion with regulators. Furthermore, addressing extended remediation time frames caused by matrix diffusion leads to project cost savings.